Quantcast
Channel: How To
Viewing all 466 articles
Browse latest View live

How to capture and analyze packets with tcpdump command on Linux

$
0
0

tcpdump is a well known command line packet analyzer tool. Using tcpdump command we can capture the live TCP/IP packets and these packets can also be saved to a file. Later on these captured packets can be analyzed via tcpdump command. tcpdump command becomes very handy when it comes to troubleshooting on network level.

tcpdump-command-examples-linux

tcpdump is available in most of the Linux distributions, for Debian based Linux, it be can be installed using apt command,

# apt install tcpdump -y

On RPM based Linux OS, tcpdump can be installed using below yum command

# yum install tcpdump -y

When we run the tcpdump command without any options then it will capture packets of all the interfaces. So to stop or cancel the tcpdump command, type “ctrl+c” . In this tutorial we will discuss how to capture and analyze packets using different practical examples,

Example:1) Capturing packets from a specific interface

When we run the tcpdump command without any options, it will capture packets on the all interfaces, so to capture the packets from a specific interface use the option ‘-i‘ followed by the interface name.

Syntax :

# tcpdump -i {interface-name}

Let’s assume, i want to capture packets from interface “enp0s3”

[root@compute-0-1 ~]# tcpdump -i enp0s3

Output would be something like below,

tcpdump: verbose output suppressed, use -v or -vv for full protocol decode
listening on enp0s3, link-type EN10MB (Ethernet), capture size 262144 bytes
06:43:22.905890 IP compute-0-1.example.com.ssh > 169.144.0.1.39374: Flags [P.], seq 21952160:21952540, ack 13537, win 291, options [nop,nop,TS val 26164373 ecr 6580205], length 380
06:43:22.906045 IP compute-0-1.example.com.ssh > 169.144.0.1.39374: Flags [P.], seq 21952540:21952760, ack 13537, win 291, options [nop,nop,TS val 26164373 ecr 6580205], length 220
06:43:22.906150 IP compute-0-1.example.com.ssh > 169.144.0.1.39374: Flags [P.], seq 21952760:21952980, ack 13537, win 291, options [nop,nop,TS val 26164373 ecr 6580205], length 220
06:43:22.906291 IP 169.144.0.1.39374 > compute-0-1.example.com.ssh: Flags [.], ack 21952980, win 13094, options [nop,nop,TS val 6580205 ecr 26164373], length 0
06:43:22.906303 IP 169.144.0.1.39374 > compute-0-1.example.com.ssh: Flags [P.], seq 13537:13609, ack 21952980, win 13094, options [nop,nop,TS val 6580205 ecr 26164373], length 72
06:43:22.906322 IP compute-0-1.example.com.ssh > 169.144.0.1.39374: Flags [P.], seq 21952980:21953200, ack 13537, win 291, options [nop,nop,TS val 26164373 ecr 6580205], length 220
^C
109930 packets captured
110065 packets received by filter
133 packets dropped by kernel
[root@compute-0-1 ~]#

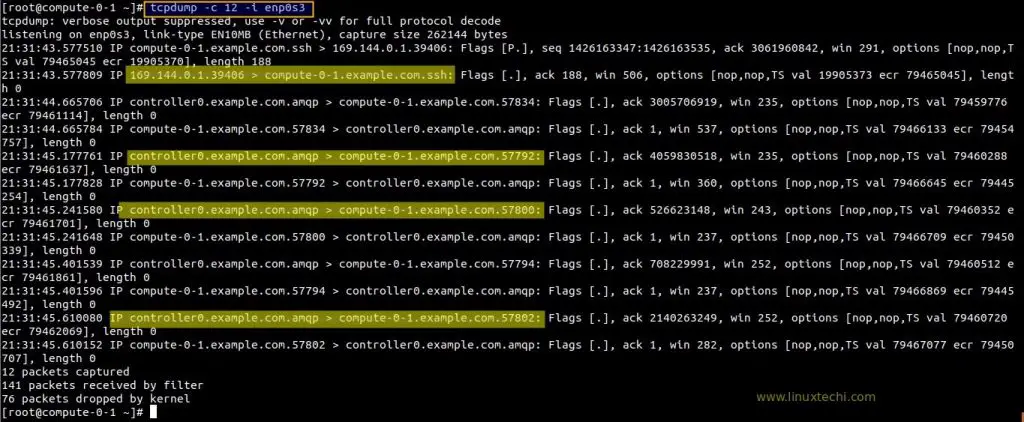
Example:2) Capturing specific number number of packet from a specific interface

Let’s assume we want to capture 12 packets from the specific interface like “enp0s3”, this can be easily achieved using the options “-c {number} -i {interface-name}

root@compute-0-1 ~]# tcpdump -c 12 -i enp0s3

Above command will generate the output something like below

N-Number-Packsets-tcpdump-interface

Example:3) Display all the available Interfaces for tcpdump

Use ‘-D‘ option to display all the available interfaces for tcpdump command,

[root@compute-0-1 ~]# tcpdump -D
1.enp0s3
2.enp0s8
3.ovs-system
4.br-int
5.br-tun
6.nflog (Linux netfilter log (NFLOG) interface)
7.nfqueue (Linux netfilter queue (NFQUEUE) interface)
8.usbmon1 (USB bus number 1)
9.usbmon2 (USB bus number 2)
10.qbra692e993-28
11.qvoa692e993-28
12.qvba692e993-28
13.tapa692e993-28
14.vxlan_sys_4789
15.any (Pseudo-device that captures on all interfaces)
16.lo [Loopback]
[root@compute-0-1 ~]#

I am running the tcpdump command on one of my openstack compute node, that’s why in the output you have seen number interfaces, tab interface, bridges and vxlan interface.

Example:4) Capturing packets with human readable timestamp (-tttt option)

By default in tcpdump command output, there is no proper human readable timestamp, if you want to associate human readable timestamp to each captured packet then use ‘-tttt‘ option, example is shown below,

[root@compute-0-1 ~]# tcpdump -c 8 -tttt -i enp0s3
tcpdump: verbose output suppressed, use -v or -vv for full protocol decode
listening on enp0s3, link-type EN10MB (Ethernet), capture size 262144 bytes
2018-08-25 23:23:36.954883 IP compute-0-1.example.com.ssh > 169.144.0.1.39406: Flags [P.], seq 1449206247:1449206435, ack 3062020950, win 291, options [nop,nop,TS val 86178422 ecr 21583714], length 188
2018-08-25 23:23:36.955046 IP 169.144.0.1.39406 > compute-0-1.example.com.ssh: Flags [.], ack 188, win 13585, options [nop,nop,TS val 21583717 ecr 86178422], length 0
2018-08-25 23:23:37.140097 IP controller0.example.com.amqp > compute-0-1.example.com.57818: Flags [P.], seq 814607956:814607964, ack 2387094506, win 252, options [nop,nop,TS val 86172228 ecr 86176695], length 8
2018-08-25 23:23:37.140175 IP compute-0-1.example.com.57818 > controller0.example.com.amqp: Flags [.], ack 8, win 237, options [nop,nop,TS val 86178607 ecr 86172228], length 0
2018-08-25 23:23:37.355238 IP compute-0-1.example.com.57836 > controller0.example.com.amqp: Flags [P.], seq 1080415080:1080417400, ack 1690909362, win 237, options [nop,nop,TS val 86178822 ecr 86163054], length 2320
2018-08-25 23:23:37.357119 IP controller0.example.com.amqp > compute-0-1.example.com.57836: Flags [.], ack 2320, win 1432, options [nop,nop,TS val 86172448 ecr 86178822], length 0
2018-08-25 23:23:37.357545 IP controller0.example.com.amqp > compute-0-1.example.com.57836: Flags [P.], seq 1:22, ack 2320, win 1432, options [nop,nop,TS val 86172449 ecr 86178822], length 21
2018-08-25 23:23:37.357572 IP compute-0-1.example.com.57836 > controller0.example.com.amqp: Flags [.], ack 22, win 237, options [nop,nop,TS val 86178825 ecr 86172449], length 0
8 packets captured
134 packets received by filter
69 packets dropped by kernel
[root@compute-0-1 ~]#

Example:5) Capturing and saving packets to a file (-w option)

Use “-w” option in tcpdump command to save the capture TCP/IP packet to a file, so that we can analyze those packets in the future for further analysis.

Syntax :

# tcpdump -w file_name.pcap -i {interface-name}

Note: Extension of file must be .pcap

Let’s assume i want to save the captured packets of interface “enp0s3” to a file name enp0s3-26082018.pcap

[root@compute-0-1 ~]# tcpdump -w enp0s3-26082018.pcap -i enp0s3

Above command will generate the output something like below,

[root@compute-0-1 ~]# tcpdump -w enp0s3-26082018.pcap -i enp0s3
tcpdump: listening on enp0s3, link-type EN10MB (Ethernet), capture size 262144 bytes
^C841 packets captured
845 packets received by filter
0 packets dropped by kernel
[root@compute-0-1 ~]# ls
anaconda-ks.cfg enp0s3-26082018.pcap
[root@compute-0-1 ~]#

Capturing and Saving the packets whose size greater than N bytes

[root@compute-0-1 ~]# tcpdump -w enp0s3-26082018-2.pcap greater 1024

Capturing and Saving the packets whose size less than N bytes

[root@compute-0-1 ~]# tcpdump -w enp0s3-26082018-3.pcap less 1024

Example:6) Reading packets from the saved file ( -r option)

In the above example we have saved the captured packets to a file, we can read those packets from the file using the option ‘-r‘, example is shown below,

[root@compute-0-1 ~]# tcpdump -r enp0s3-26082018.pcap

Reading the packets with human readable timestamp,

[root@compute-0-1 ~]# tcpdump -tttt -r enp0s3-26082018.pcap
reading from file enp0s3-26082018.pcap, link-type EN10MB (Ethernet)
2018-08-25 22:03:17.249648 IP compute-0-1.example.com.ssh > 169.144.0.1.39406: Flags [P.], seq 1426167803:1426167927, ack 3061962134, win 291, options
[nop,nop,TS val 81358717 ecr 20378789], length 124
2018-08-25 22:03:17.249840 IP 169.144.0.1.39406 > compute-0-1.example.com.ssh: Flags [.], ack 124, win 564, options [nop,nop,TS val 20378791 ecr 81358
717], length 0
2018-08-25 22:03:17.454559 IP controller0.example.com.amqp > compute-0-1.example.com.57836: Flags [.], ack 1079416895, win 1432, options [nop,nop,TS v
al 81352560 ecr 81353913], length 0
2018-08-25 22:03:17.454642 IP compute-0-1.example.com.57836 > controller0.example.com.amqp: Flags [.], ack 1, win 237, options [nop,nop,TS val 8135892
2 ecr 81317504], length 0
2018-08-25 22:03:17.646945 IP compute-0-1.example.com.57788 > controller0.example.com.amqp: Flags [.], seq 106760587:106762035, ack 688390730, win 237
, options [nop,nop,TS val 81359114 ecr 81350901], length 1448
2018-08-25 22:03:17.647043 IP compute-0-1.example.com.57788 > controller0.example.com.amqp: Flags [P.], seq 1448:1956, ack 1, win 237, options [nop,no
p,TS val 81359114 ecr 81350901], length 508
2018-08-25 22:03:17.647502 IP controller0.example.com.amqp > compute-0-1.example.com.57788: Flags [.], ack 1956, win 1432, options [nop,nop,TS val 813
52753 ecr 81359114], length 0
.........................................................................................................................

Read More on : How to Install and Use Wireshark on Debian 9 / Ubuntu 16.04

Example:7) Capturing only IP address packets on a specific Interface (-n option)

Using -n option in tcpdum command we can capture only IP address packets on specific interface, example is shown below,

[root@compute-0-1 ~]# tcpdump -n -i enp0s3

Output of above command would be something like below,

tcpdump: verbose output suppressed, use -v or -vv for full protocol decode
listening on enp0s3, link-type EN10MB (Ethernet), capture size 262144 bytes
22:22:28.537904 IP 169.144.0.20.ssh > 169.144.0.1.39406: Flags [P.], seq 1433301395:1433301583, ack 3061976250, win 291, options [nop,nop,TS val 82510005 ecr 20666610], length 188
22:22:28.538173 IP 169.144.0.1.39406 > 169.144.0.20.ssh: Flags [.], ack 188, win 9086, options [nop,nop,TS val 20666613 ecr 82510005], length 0
22:22:28.538573 IP 169.144.0.20.ssh > 169.144.0.1.39406: Flags [P.], seq 188:552, ack 1, win 291, options [nop,nop,TS val 82510006 ecr 20666613], length 364
22:22:28.538736 IP 169.144.0.1.39406 > 169.144.0.20.ssh: Flags [.], ack 552, win 9086, options [nop,nop,TS val 20666613 ecr 82510006], length 0
22:22:28.538874 IP 169.144.0.20.ssh > 169.144.0.1.39406: Flags [P.], seq 552:892, ack 1, win 291, options [nop,nop,TS val 82510006 ecr 20666613], length 340
22:22:28.539042 IP 169.144.0.1.39406 > 169.144.0.20.ssh: Flags [.], ack 892, win 9086, options [nop,nop,TS val 20666613 ecr 82510006], length 0
22:22:28.539178 IP 169.144.0.20.ssh > 169.144.0.1.39406: Flags [P.], seq 892:1232, ack 1, win 291, options [nop,nop,TS val 82510006 ecr 20666613], length 340
22:22:28.539282 IP 169.144.0.1.39406 > 169.144.0.20.ssh: Flags [.], ack 1232, win 9086, options [nop,nop,TS val 20666614 ecr 82510006], length 0
22:22:28.539479 IP 169.144.0.20.ssh > 169.144.0.1.39406: Flags [P.], seq 1232:1572, ack 1, win 291, options [nop,nop,TS val 82510006 ecr 20666614], length 340
22:22:28.539595 IP 169.144.0.1.39406 > 169.144.0.20.ssh: Flags [.], ack 1572, win 9086, options [nop,nop,TS val 20666614 ecr 82510006], length 0
22:22:28.539760 IP 169.144.0.20.ssh > 169.144.0.1.39406: Flags [P.], seq 1572:1912, ack 1, win 291, options [nop,nop,TS val 82510007 ecr 20666614], length 340
.........................................................................

You can also capture N number of IP address packets using -c and -n option in tcpdump command,

[root@compute-0-1 ~]# tcpdump -c 25 -n -i enp0s3

Example:8) Capturing only TCP packets on a specific interface

In tcpdump command we can capture only tcp packets using the ‘tcp‘ option,

[root@compute-0-1 ~]# tcpdump -i enp0s3 tcp
tcpdump: verbose output suppressed, use -v or -vv for full protocol decode
listening on enp0s3, link-type EN10MB (Ethernet), capture size 262144 bytes
22:36:54.521053 IP 169.144.0.20.ssh > 169.144.0.1.39406: Flags [P.], seq 1433336467:1433336655, ack 3061986618, win 291, options [nop,nop,TS val 83375988 ecr 20883106], length 188
22:36:54.521474 IP 169.144.0.1.39406 > 169.144.0.20.ssh: Flags [.], ack 188, win 9086, options [nop,nop,TS val 20883109 ecr 83375988], length 0
22:36:54.522214 IP 169.144.0.20.ssh > 169.144.0.1.39406: Flags [P.], seq 188:552, ack 1, win 291, options [nop,nop,TS val 83375989 ecr 20883109], length 364
22:36:54.522508 IP 169.144.0.1.39406 > 169.144.0.20.ssh: Flags [.], ack 552, win 9086, options [nop,nop,TS val 20883109 ecr 83375989], length 0
22:36:54.522867 IP 169.144.0.20.ssh > 169.144.0.1.39406: Flags [P.], seq 552:892, ack 1, win 291, options [nop,nop,TS val 83375990 ecr 20883109], length 340
22:36:54.523006 IP 169.144.0.1.39406 > 169.144.0.20.ssh: Flags [.], ack 892, win 9086, options [nop,nop,TS val 20883109 ecr 83375990], length 0
22:36:54.523304 IP 169.144.0.20.ssh > 169.144.0.1.39406: Flags [P.], seq 892:1232, ack 1, win 291, options [nop,nop,TS val 83375990 ecr 20883109], length 340
22:36:54.523461 IP 169.144.0.1.39406 > 169.144.0.20.ssh: Flags [.], ack 1232, win 9086, options [nop,nop,TS val 20883110 ecr 83375990], length 0
22:36:54.523604 IP 169.144.0.20.ssh > 169.144.0.1.39406: Flags [P.], seq 1232:1572, ack 1, win 291, options [nop,nop,TS val 83375991 ecr 20883110], length 340
...................................................................................................................................................

Example:9) Capturing packets from a specific port on a specific interface

Using tcpdump command we can capture packet from a specific port (e.g 22) on a specific interface enp0s3

Syntax :

# tcpdump -i {interface-name} port {Port_Number}

[root@compute-0-1 ~]# tcpdump -i enp0s3 port 22
tcpdump: verbose output suppressed, use -v or -vv for full protocol decode
listening on enp0s3, link-type EN10MB (Ethernet), capture size 262144 bytes
22:54:45.032412 IP compute-0-1.example.com.ssh > 169.144.0.1.39406: Flags [P.], seq 1435010787:1435010975, ack 3061993834, win 291, options [nop,nop,TS val 84446499 ecr 21150734], length 188
22:54:45.032631 IP 169.144.0.1.39406 > compute-0-1.example.com.ssh: Flags [.], ack 188, win 9131, options [nop,nop,TS val 21150737 ecr 84446499], length 0
22:54:55.037926 IP compute-0-1.example.com.ssh > 169.144.0.1.39406: Flags [P.], seq 188:576, ack 1, win 291, options [nop,nop,TS val 84456505 ecr 21150737], length 388
22:54:55.038106 IP 169.144.0.1.39406 > compute-0-1.example.com.ssh: Flags [.], ack 576, win 9154, options [nop,nop,TS val 21153238 ecr 84456505], length 0
22:54:55.038286 IP compute-0-1.example.com.ssh > 169.144.0.1.39406: Flags [P.], seq 576:940, ack 1, win 291, options [nop,nop,TS val 84456505 ecr 21153238], length 364
22:54:55.038564 IP 169.144.0.1.39406 > compute-0-1.example.com.ssh: Flags [.], ack 940, win 9177, options [nop,nop,TS val 21153238 ecr 84456505], length 0
22:54:55.038708 IP compute-0-1.example.com.ssh > 169.144.0.1.39406: Flags [P.], seq 940:1304, ack 1, win 291, options [nop,nop,TS val 84456506 ecr 21153238], length 364
............................................................................................................................
[root@compute-0-1 ~]#

Example:10) Capturing the packets from a Specific Source IP on a Specific Interface

Using “src” keyword followed by “ip address” in tcpdump command we can capture the packets from a specific Source IP,

syntax :

# tcpdump -n -i {interface-name} src {ip-address}

Example is shown below,

[root@compute-0-1 ~]# tcpdump -n -i enp0s3 src 169.144.0.10
tcpdump: verbose output suppressed, use -v or -vv for full protocol decode
listening on enp0s3, link-type EN10MB (Ethernet), capture size 262144 bytes
23:03:45.912733 IP 169.144.0.10.amqp > 169.144.0.20.57800: Flags [.], ack 526623844, win 243, options [nop,nop,TS val 84981008 ecr 84982372], length 0
23:03:46.136757 IP 169.144.0.10.amqp > 169.144.0.20.57796: Flags [.], ack 2535995970, win 252, options [nop,nop,TS val 84981232 ecr 84982596], length 0
23:03:46.153398 IP 169.144.0.10.amqp > 169.144.0.20.57798: Flags [.], ack 3623063621, win 243, options [nop,nop,TS val 84981248 ecr 84982612], length 0
23:03:46.361160 IP 169.144.0.10.amqp > 169.144.0.20.57802: Flags [.], ack 2140263945, win 252, options [nop,nop,TS val 84981456 ecr 84982821], length 0
23:03:46.376926 IP 169.144.0.10.amqp > 169.144.0.20.57808: Flags [.], ack 175946224, win 252, options [nop,nop,TS val 84981472 ecr 84982836], length 0
23:03:46.505242 IP 169.144.0.10.amqp > 169.144.0.20.57810: Flags [.], ack 1016089556, win 252, options [nop,nop,TS val 84981600 ecr 84982965], length 0
23:03:46.616994 IP 169.144.0.10.amqp > 169.144.0.20.57812: Flags [.], ack 832263835, win 252, options [nop,nop,TS val 84981712 ecr 84983076], length 0
23:03:46.809344 IP 169.144.0.10.amqp > 169.144.0.20.57814: Flags [.], ack 2781799939, win 252, options [nop,nop,TS val 84981904 ecr 84983268], length 0
23:03:46.809485 IP 169.144.0.10.amqp > 169.144.0.20.57816: Flags [.], ack 1662816815, win 252, options [nop,nop,TS val 84981904 ecr 84983268], length 0
23:03:47.033301 IP 169.144.0.10.amqp > 169.144.0.20.57818: Flags [.], ack 2387094362, win 252, options [nop,nop,TS val 84982128 ecr 84983492], length 0
^C
10 packets captured
12 packets received by filter
0 packets dropped by kernel
[root@compute-0-1 ~]#

Example:11) Capturing packets from a specific destination IP on a specific Interface

Syntax :

# tcpdump -n -i {interface-name} dst {IP-address}

[root@compute-0-1 ~]# tcpdump -n -i enp0s3 dst 169.144.0.1
tcpdump: verbose output suppressed, use -v or -vv for full protocol decode
listening on enp0s3, link-type EN10MB (Ethernet), capture size 262144 bytes
23:10:43.520967 IP 169.144.0.20.ssh > 169.144.0.1.39406: Flags [P.], seq 1439564171:1439564359, ack 3062005550, win 291, options [nop,nop,TS val 85404988 ecr 21390356], length 188
23:10:43.521441 IP 169.144.0.20.ssh > 169.144.0.1.39406: Flags [P.], seq 188:408, ack 1, win 291, options [nop,nop,TS val 85404988 ecr 21390359], length 220
23:10:43.521719 IP 169.144.0.20.ssh > 169.144.0.1.39406: Flags [P.], seq 408:604, ack 1, win 291, options [nop,nop,TS val 85404989 ecr 21390359], length 196
23:10:43.521993 IP 169.144.0.20.ssh > 169.144.0.1.39406: Flags [P.], seq 604:800, ack 1, win 291, options [nop,nop,TS val 85404989 ecr 21390359], length 196
23:10:43.522157 IP 169.144.0.20.ssh > 169.144.0.1.39406: Flags [P.], seq 800:996, ack 1, win 291, options [nop,nop,TS val 85404989 ecr 21390359], length 196
23:10:43.522346 IP 169.144.0.20.ssh > 169.144.0.1.39406: Flags [P.], seq 996:1192, ack 1, win 291, options [nop,nop,TS val 85404989 ecr 21390359], length 196
.........................................................................................

Example:12) Capturing TCP packet communication between two Hosts

Let’s assume i want to capture tcp packets between two hosts 169.144.0.1 & 169.144.0.20, example is shown below,

[root@compute-0-1 ~]# tcpdump -w two-host-tcp-comm.pcap -i enp0s3 tcp and \(host 169.144.0.1 or host 169.144.0.20\)

Capturing only SSH packet flow between two hosts using tcpdump command,

[root@compute-0-1 ~]# tcpdump -w ssh-comm-two-hosts.pcap -i enp0s3 src 169.144.0.1 and port 22 and dst 169.144.0.20 and port 22

Example:13) Capturing the udp network packets (to & fro) between two hosts

Syntax :

# tcpdump -w -s -i udp and \(host and host \)

[root@compute-0-1 ~]# tcpdump -w two-host-comm.pcap -s 1000 -i enp0s3 udp and \(host 169.144.0.10 and host 169.144.0.20\)

Example:14) Capturing packets in HEX and ASCII Format

Using tcpdump command, we can capture tcp/ip packet in ASCII and HEX format,

To capture the packets in ASCII format use -A option, example is shown below,

[root@compute-0-1 ~]# tcpdump -c 10 -A -i enp0s3
tcpdump: verbose output suppressed, use -v or -vv for full protocol decode
listening on enp0s3, link-type EN10MB (Ethernet), capture size 262144 bytes
00:37:10.520060 IP compute-0-1.example.com.ssh > 169.144.0.1.39406: Flags [P.], seq 1452637331:1452637519, ack 3062125586, win 333, options [nop,nop,TS val 90591987 ecr 22687106], length 188
E...[.@.@...............V.|...T....MT......
.fR..Z-....b.:..Z5...{.'p....]."}...Z..9.?.......".@<.....V..C.....{,...OKP.2.*...`..-sS..1S...........:.O[.....{G..%ze.Pn.T..N.... ....qB..5...n.....`...:=...[..0....k.....S.:..5!.9..G....!-..'..
00:37:10.520319 IP 169.144.0.1.39406 > compute-0-1.example.com.ssh: Flags [.], ack 188, win 13930, options [nop,nop,TS val 22687109 ecr 90591987], length 0
E..4kS@.@.|+..............T.V.}O..6j.d.....
.Z-..fR.
00:37:11.687543 IP controller0.example.com.amqp > compute-0-1.example.com.57800: Flags [.], ack 526624548, win 243, options [nop,nop,TS val 90586768 ecr 90588146], length 0
E..4.9@.@.!L...
.....(..g....c.$...........
.f>..fC.
00:37:11.687612 IP compute-0-1.example.com.57800 > controller0.example.com.amqp: Flags [.], ack 1, win 237, options [nop,nop,TS val 90593155 ecr 90551716], length 0
E..4..@.@..........
...(.c.$g.......Se.....
.fW..e..
..................................................................................................................................................

To Capture the packets both in HEX and ASCII format use -XX option

[root@compute-0-1 ~]# tcpdump -c 10 -XX -i enp0s3
tcpdump: verbose output suppressed, use -v or -vv for full protocol decode
listening on enp0s3, link-type EN10MB (Ethernet), capture size 262144 bytes
00:39:15.124363 IP compute-0-1.example.com.ssh > 169.144.0.1.39406: Flags [P.], seq 1452640859:1452641047, ack 3062126346, win 333, options [nop,nop,TS val 90716591 ecr 22718257], length 188
0x0000: 0a00 2700 0000 0800 27f4 f935 0800 4510 ..'.....'..5..E.
0x0010: 00f0 5bc6 4000 4006 8afc a990 0014 a990 ..[.@.@.........
0x0020: 0001 0016 99ee 5695 8a5b b684 570a 8018 ......V..[..W...
0x0030: 014d 5418 0000 0101 080a 0568 39af 015a .MT........h9..Z
0x0040: a731 adb7 58b6 1a0f 2006 df67 c9b6 4479 .1..X......g..Dy
0x0050: 19fd 2c3d 2042 3313 35b9 a160 fa87 d42c ..,=.B3.5..`...,
0x0060: 89a9 3d7d dfbf 980d 2596 4f2a 99ba c92a ..=}....%.O*...*
0x0070: 3e1e 7bf7 3af2 a5cc ee4f 10bc 7dfc 630d >.{.:....O..}.c.
0x0080: 898a 0e16 6825 56c7 b683 1de4 3526 ff04 ....h%V.....5&..
0x0090: 68d1 4f7d babd 27ba 84ae c5d3 750b 01bd h.O}..'.....u...
0x00a0: 9c43 e10a 33a6 8df2 a9f0 c052 c7ed 2ff5 .C..3......R../.
0x00b0: bfb1 ce84 edfc c141 6dad fa19 0702 62a7 .......Am.....b.
0x00c0: 306c db6b 2eea 824e eea5 acd7 f92e 6de3 0l.k...N......m.
0x00d0: 85d0 222d f8bf 9051 2c37 93c8 506d 5cb5 .."-...Q,7..Pm\.
0x00e0: 3b4a 2a80 d027 49f2 c996 d2d9 a9eb c1c4 ;J*..'I.........
0x00f0: 7719 c615 8486 d84c e42d 0ba3 698c w......L.-..i.
00:39:15.124648 IP 169.144.0.1.39406 > compute-0-1.example.com.ssh: Flags [.], ack 188, win 13971, options [nop,nop,TS val 22718260 ecr 90716591], length 0
0x0000: 0800 27f4 f935 0a00 2700 0000 0800 4510 ..'..5..'.....E.
0x0010: 0034 6b70 4000 4006 7c0e a990 0001 a990 .4kp@.@.|.......
0x0020: 0014 99ee 0016 b684 570a 5695 8b17 8010 ........W.V.....
0x0030: 3693 7c0e 0000 0101 080a 015a a734 0568 6.|........Z.4.h
0x0040: 39af
.......................................................................

That’s all from this article, i hope you got an idea how to capture and analyze tcp/ip packets using tcpdump command. Please do share your feedback and comments.


How to Install and Configure Nginx ‘Web Server’ on Ubuntu 18.04 / Debian 9

$
0
0

Nginx is a free and open source web server, it can also be used as reverse proxy, HTTP load balancer, HTTP Cache and mail proxy. Nginx is available for all the Unix like operating systems and released under BSD-like license.

In tutorial we will learn how to install latest version of Ngnix on Ubuntu 18.04 LTS and Debian 9 Server,

Nginx Installation on Ubuntu 18.04 LTS / Debian 9

Installation steps of Nginx on both OS Ubuntu 18.04 and Debian 9 is identical, run the beneath commands one after the another from the terminal,

pkumar@linuxtechi:~$ sudo apt update
pkumar@linuxtechi:~$ sudo apt install nginx -y

Start & enable Nginx service

Run the below commands to start and enable nginx service,

pkumar@linuxtechi:~$ sudo systemctl start nginx
pkumar@linuxtechi:~$ sudo systemctl enable nginx
Synchronizing state of nginx.service with SysV service script with /lib/systemd/systemd-sysv-install.
Executing: /lib/systemd/systemd-sysv-install enable nginx
pkumar@linuxtechi:~$

Use below commands to verify the ngnix service status,

pkumar@linuxtechi:~$ sudo systemctl status nginx
pkumar@linuxtechi:~$ sudo systemctl is-active nginx

Output of above commands would be something like below,

Nginx-Service-status-Ubuntu

Allow Nginx Ports ( 80 & 443 ) in OS firewall

In case OS firewall is enabled and configured on your Ubuntu 18.04 and Debian 9 Server then execute the below ufw commands to allow 80 and 443 port,

pkumar@linuxtechi:~$ sudo ufw allow 80/tcp
Rules updated
Rules updated (v6)
pkumar@linuxtechi:~$ sudo ufw allow 443/tcp
Rules updated
Rules updated (v6)
pkumar@linuxtechi:~$

Now Verify rules using the below command,

pkumar@linuxtechi:~$ sudo ufw status numbered
Status: active
     To                         Action      From
     --                         ------      ----
[ 1] 80/tcp                     ALLOW IN    Anywhere
[ 2] 443/tcp                    ALLOW IN    Anywhere
[ 3] 22/tcp                     ALLOW IN    Anywhere
[ 4] 80/tcp (v6)                ALLOW IN    Anywhere (v6)
[ 5] 443/tcp (v6)               ALLOW IN    Anywhere (v6)
[ 6] 22/tcp (v6)                ALLOW IN    Anywhere (v6)
pkumar@linuxtechi:~$

Once you are done with above changes, let’s verify the Nginx Welcome Page!!!

Open your Web browser, type : http://{Your-Server-IP-Address}

Welcome-nginx-Page-Ubuntu

Server Block / Virtual Host in Nginx

In Apache Web Server we have virtual hosts concept where we can define details of multiple web sites, similarly in Nginx we have Server blocks means block for each web site, let’s look into the default server block (/etc/nginx/sites-available/default) and then we will create our own site’s server block,

pkumar@linuxtechi:~$ sudo vi /etc/nginx/sites-available/default

Default-Server-Block-Nginx

Define Your Custom Server Block

Let’s assume I want to create a custom server block for web Server www.linuxtechi.lan,

Create a document root using below command,

pkumar@linuxtechi:~$ sudo mkdir  /var/www/linuxtechi

Create a index.html under Web Server document root,

pkumar@linuxtechi:~$ sudo vi /var/www/linuxtechi/index.html
<!DOCTYPE html>
<html>
<head>
<title>Welcome to LinuxTechi</title>
</head>
<body>
<h1>Welcome to LinuxTechi</h1>
<p>LinuxTechi Test Page running on NGINX Web Server - Ubuntu 18.04</p>
</body>
</html>

Now create your server block by creating a file “linuxtechi.lan” with the following content under the folder /etc/nginx/sites-available

pkumar@linuxtechi:~$ sudo vi /etc/nginx/sites-available/linuxtechi.lan
server {
    listen 80;
    root /var/www/linuxtechi;
    index index.html;
    server_name www.linuxtechi.lan;
}

To activate the above created server block, create a symbolic link from “/etc/nginx/sites-available/linuxtechi.lan” to “/etc/nginx/sites-enabled

pkumar@linuxtechi:~$ sudo ln -s /etc/nginx/sites-available/linuxtechi.lan /etc/nginx/sites-enabled

Now restart your nginx service using below command,

pkumar@linuxtechi:~$ sudo systemctl restart nginx

Note: In case you don’t have DNS server then you should add below entries in hosts file of your client machine,

192.168.0.107 www.linuxtechi.lan

Now access your web server via url : http://{Web-Server-Name}

In my case , url is http://www.linuxtechi.lan

Nginx-LinuxTechi-Test-Pages

Enable SSL Certificates for Your NGINX Server

As of now our nginx web server is running on non-secure port 80, to make the web server secure then we need to install ssl certificates. You can get the SSL certificates from the trusted sources or you can also use self-signed certificates generated via openssl command.

In this tutorial I am generating the certificates for my web server using openssl command,

pkumar@linuxtechi:~$ sudo openssl req -x509 -days 703 -sha256 -newkey rsa:2048 -nodes -keyout /etc/ssl/private/linuxtechi.key -out /etc/ssl/certs/linuxtechi-cert.pem
[sudo] password for pkumar:
Generating a 2048 bit RSA private key
........................................................................
writing new private key to '/etc/ssl/private/linuxtechi.key'
-----
You are about to be asked to enter information that will be incorporated
into your certificate request.
What you are about to enter is what is called a Distinguished Name or a DN.
There are quite a few fields but you can leave some blank
For some fields there will be a default value,
If you enter '.', the field will be left blank.
-----
Country Name (2 letter code) [AU]:IN
State or Province Name (full name) [Some-State]:Delhi
Locality Name (eg, city) []:Delhi
Organization Name (eg, company) [Internet Widgits Pty Ltd]:LinuxTechi
Organizational Unit Name (eg, section) []:IT
Common Name (e.g. server FQDN or YOUR name) []:www.linuxtechi.lan
Email Address []:info@linuxtechi.lan
pkumar@linuxtechi:~$

Above command has generated the private key with “linuxtechi.key” and certificates with name “linuxtechi-cert.pem“, these certificates will be applicable for the next two years.

Now update your server block, add the key and certificate location and change the web server port from 80 to 443,

pkumar@linuxtechi:~$ sudo vi /etc/nginx/sites-available/linuxtechi.lan
server {
    listen 443 ssl;
    root /var/www/linuxtechi;
    index index.html;
    server_name www.linuxtechi.lan;
    ssl_certificate /etc/ssl/certs/linuxtechi-cert.pem;
    ssl_certificate_key /etc/ssl/private/linuxtechi.key;
}

Restart the nginx service using following command,

pkumar@linuxtechi:~$ sudo systemctl restart nginx
pkumar@linuxtechi:~$

Access Your Web Server on https protocol like,

https://www.linuxtechi.lan

Note: As we have installed our self-signed certificates so we have to first time check / click on  “Add Exception” and then “Confirm Security Exception” while accessing the web server on https.

Confirm-Security-Exception-Nginx-SSL-Certs

SSL-Certs-Nginx-WebServer-Ubuntu18-04

This confirms that we have successfully enabled self-signed certificates on our Nginx Web server and concludes the article, if you like article please do share your feedback and comments in below comment section.

How to Boot Ubuntu 18.04 / Debian 9 Server in Rescue (Single User mode) / Emergency Mode

$
0
0

Booting a Linux Server into a single user mode or rescue mode is one of the important troubleshooting that a Linux admin usually follow while recovering the server from critical conditions. In Ubuntu 18.04 and Debian 9, single user mode is known as a rescue mode.

Apart from the rescue mode, Linux servers can be booted in emergency mode, the main difference between them is that, emergency mode loads a minimal environment with read only root file system file system, also it does not enable any network or other services. But rescue mode try to mount all the local file systems & try to start some important services including network.

In this article we will discuss how we can boot our Ubuntu 18.04 LTS / Debian 9 Server in rescue mode and emergency mode.

Booting Ubuntu 18.04 LTS Server in Single User / Rescue Mode:

Reboot your server and go to boot loader (Grub) screen and Select “Ubuntu“, bootloader screen would look like below,

Bootloader-Screen-Ubuntu18-04-Server

Press “e” and then go the end of line which starts with word “linux” and append “systemd.unit=rescue.target“. Remove the word “$vt_handoff ” if it exists.

rescue-target-ubuntu18-04

Now Press Ctrl-x or F10 to boot,

rescue-mode-ubuntu18-04

Now press enter and then you will get the shell where all file systems will be mounted in read-write mode and do the troubleshooting. Once you are done with troubleshooting, you can reboot your server using “reboot” command.

Booting Ubuntu 18.04 LTS Server in emergency mode

Reboot the server and go the boot loader screen and select “Ubuntu” and then press “e” and go to the end of line which starts with word linux, and append “systemd.unit=emergency.target

Emergecny-target-ubuntu18-04-server

Now Press Ctlr-x or F10 to boot in emergency mode, you will get a shell and do the troubleshooting from there. As we had already discussed that in emergency mode, file systems will be mounted in read-only mode and also there will be no networking in this mode,

Emergency-prompt-debian9

Use below command to mount the root file system in read-write mode,

# mount -o remount,rw /

Similarly, you can remount rest of file systems in read-write mode .

Booting Debian 9 into Rescue & Emergency Mode

Reboot your Debian 9.x server and go to grub screen and select “Debian GNU/Linux

Debian9-Grub-Screen

Press “e” and go to end of line which starts with word  linux and append “systemd.unit=rescue.target”  to boot the system in rescue mode and to boot in emergency mode then append “systemd.unit=emergency.target

Rescue mode :

Rescue-mode-Debian9

Now press Ctrl-x or F10 to boot in rescue mode

Rescue-Mode-Shell-Debian9

Press Enter to get the shell and from there you can start troubleshooting.

 Emergency Mode:

Emergency-target-grub-debian9

Now press ctrl-x or F10 to boot your system in emergency mode

Emergency-prompt-debian9

Press enter to get the shell and use “mount -o remount,rw /” command to mount the root file system in read-write mode.

Note: In case root password is already set in Ubuntu 18.04 and Debian 9 Server then you must enter root password to get shell in rescue and emergency mode

That’s all from this article, please do share your feedback and comments in case you like this article.

How to Install Open Source Zimbra Mail Server (ZCS 8.8.10) on CentOS 7

$
0
0

Mail Server is one of the important and critical Server for any organization as most of business communication done via emails only. In Open source world there are couple of free email server but Zimbra is one of the leading mail servers. Zimbra Mail Server a.k.a ZCS (Zimbra Collaboration Suite) comes in two versions, Open Source and enterprise version.

Prerequisites of Zimbra Mail Server (ZCS)

  • Minimal CentOS 7
  • 8 GB RAM
  • At least 5 GB Free Space on /opt
  • FQDN (Fully Qualified Domain Name), in my case it is “mail.linuxtechi.com”
  • A & MX record for your Server

In this article we will demonstrate how to install Open Source ZCS 8.8.10 on a CentOS 7.

Step:1) Login to CentOS 7 and apply updates.

Login to your CentOS 7 Server and apply the latest updates using following yum command and then reboot,

~]# yum update -y ; reboot

After the reboot, set the hostname of your server, in my case I am setting it as “mail.linuxtechi.com”

~]# hostnamectl set-hostname "mail.linuxtechi.com"
~]# exec bash

Add the following lines in  /etc/hosts file,

192.168.0.108 mail.linuxtechi.com mail

After configuring the hostname, verify the A and MX is configure for your domain using dig command,

[root@mail ~]# dig -t A mail.linuxtechi.com
[root@mail ~]# dig -t MX linuxtechi.com

Step:2) Install Zimbra dependencies using yum

Run the below command to install Zimbra / ZCS dependencies

[root@mail ~]# yum install unzip net-tools sysstat openssh-clients perl-core libaio nmap-ncat libstdc++.so.6 wget -y

Step:3) Download latest version of Zimbra (ZCS 8.8.10) using wget command

Create a folder with the name “zimbra”

[root@mail ~]# mkdir zimbra && cd zimbra

Use below wget command to download the latest version of ZCS 8.8.10 from the terminal,

[root@mail zimbra]# wget https://files.zimbra.com/downloads/8.8.10_GA/zcs-8.8.10_GA_3039.RHEL7_64.20180928094617.tgz --no-check-certificate

Step:4 Install Zimbra / ZCS 8.8.10

Extract the downloaded tgz file of  ZCS 8.8.10 using the beneath tar command

[root@mail zimbra]# tar zxpvf zcs-8.8.10_GA_3039.RHEL7_64.20180928094617.tgz

Go to extracted folder and run the install script,

[root@mail zimbra]# cd zcs-8.8.10_GA_3039.RHEL7_64.20180928094617
[root@mail zcs-8.8.10_GA_3039.RHEL7_64.20180928094617]# ./install.sh

Once we run above install script then we will get text-based installation wizard, to Accept the license, press Y

Zimbra-License-Agreement-CentOS7

Now Configure the Zimbra package repository and select the all Zimbra Components to install.

Zimbra-Package-Repo-Packages-CentOS7

Press Y to modify the System,

Modify-System-Zimbra-CentOS7

After pressing Y, it will download the Zimbra related packages and it can take time depending upon on your internet speed.

Once all the Zimbra packages are installed in the backend then we will get the below window,

MX-Record-Zimbra-Installation-CentOS7

Now Press 7 and then 4 to set admin user password,

Admin-User-Password-Set-Zimbra-Installation-CentOS7

Now press “r” to go to previous menu and then press “a” to apply the changes.

Once all the changes are applied and Zimbra related services are started then we will get the output something like below,

Zimbra-Installation-Completed-CentOS7

Open the ports in the firewall in case os firewall is running on your server

[root@mail ~]# firewall-cmd --permanent --add-port={25,80,110,143,443,465,587,993,995,5222,5223,9071,7071}/tcp
success
[root@mail ~]# firewall-cmd --reload
success
[root@mail ~]#

Step:5) Access Zimbra Admin Portal & Web Mail Client

To access the Zimbra Admin Portal, type below URL in Web Browser

https://mail.linuxtechi.com:7071/

Zimbra-Administration-CentOS7

Zimbra-Administration-Dashboard-CentOS7

To access Zimbra Mail Web Client, type the following URL in the browser

https://mail.linuxtechi.com

Zimbra-WebClient-SignIn-CentOS7

Zimbra-Inbox-Dashboard-CentOS7

Note: For both the URLs we can use user name as “admin” and password that we set during the installation

Step:6) Troubleshooting Zimbra Services and Logs

There can be some scenarios where some zimbra services might be stopped, to find zimbra services status from command line, run the following command,

[root@mail ~]# su - zimbra
Last login: Sun Oct  7 14:59:48 IST 2018 on pts/0
[zimbra@mail ~]$ zmcontrol status
Host mail.linuxtechi.com
        amavis                  Running
        antispam                Running
        antivirus               Running
        dnscache                Running
        imapd                   Running
        ldap                    Running
        logger                  Running
        mailbox                 Running
        memcached               Running
        mta                     Running
        opendkim                Running
        proxy                   Running
        service webapp          Running
        snmp                    Running
        spell                   Running
        stats                   Running
        zimbra webapp           Running
        zimbraAdmin webapp      Running
        zimlet webapp           Running
        zmconfigd               Running
[zimbra@mail ~]$

To restart the Zimbra Services use the following command,

[zimbra@mail ~]$ zmcontrol restart
Host mail.linuxtechi.com
        Stopping zmconfigd...Done.
        Stopping imapd...Done.
        Stopping zimlet webapp...Done.
        Stopping zimbraAdmin webapp...Done.
        Stopping zimbra webapp...Done.
        Stopping service webapp...Done.
        Stopping stats...Done.
        Stopping mta...Done.
        Stopping spell...Done.
        Stopping snmp...Done.
        Stopping cbpolicyd...Done.
        Stopping archiving...Done.
        Stopping opendkim...Done.
        Stopping amavis...Done.
        Stopping antivirus...Done.
        Stopping antispam...Done.
        Stopping proxy...Done.
        Stopping memcached...Done.
        Stopping mailbox...Done.
        Stopping logger...Done.
        Stopping dnscache...Done.
        Stopping ldap...Done.
Host mail.linuxtechi.com
        Starting ldap...Done.
        Starting zmconfigd...Done.
        Starting dnscache...Done.
        Starting logger...Done.
        Starting mailbox...Done.
        Starting memcached...Done.
        Starting proxy...Done.
        Starting amavis...Done.
        Starting antispam...Done.
        Starting antivirus...Done.
        Starting opendkim...Done.
        Starting snmp...Done.
        Starting spell...Done.
        Starting mta...Done.
        Starting stats...Done.
        Starting service webapp...Done.
        Starting zimbra webapp...Done.
        Starting zimbraAdmin webapp...Done.
        Starting zimlet webapp...Done.
        Starting imapd...Done.
[zimbra@mail ~]$

All the log files for Zimbra server are kept under the folder “/opt/zimbra/log”

Note: In my case postfix was already installed and running on my centos 7 server because of that Zimbra MTA service was getting stopped and failed. To resolve this issue, I have to stopped and disable the postfix service and then restart Zimbra service using the “zmcontrol” command.

When you are done with Zimbra testing and want to uninstall it from the system, then run the “install.sh” script followed by “-u

[root@mail ~]# cd /root/zimbra/zcs-8.8.10_GA_3039.RHEL7_64.20180928094617
[root@mail zcs-8.8.10_GA_3039.RHEL7_64.20180928094617]# ./install.sh -u

That’s conclude this article. If you find it informative please do share this among your Linux technical friends and share the feedback and comments in the comment section below.

How to Install VirtualBox and Extension Pack on Elementary OS 5.0 (Juno)

$
0
0

VirtualBox is a free and open source Virtualization tool that allows to run multiple virtual machines at same time on your Linux and Windows desktop or laptop. VirtualBox is generally used at desktop level and new users can easily use this tool because of its user-friendly interface.

Recently latest version of Elementary OS (Juno) has been released with new features and improvements. In this article we will demonstrate how to install VirtualBox and its extension pack on Elementary OS 5 or Juno.

Installation of VirtualBox from Command line

VirtualBox 5.2.10 is available in the default Elementary OS package repositories, Open the terminal and type the following apt-get commands,

pkumar@linuxtechi:~$ sudo apt-get update
pkumar@linuxtechi:~$ sudo apt-get install virtualbox -y

Installation of VirtualBox via AppCentre

If you are not comfortable on command line then Elementary OS provide AppCenter as a Graphical user interface through we can easily add and remove applications.

Start the AppCentre, search virtualbox

VirtualBox-AppCentre-ElementaryOS-Juno

Click on VirtualBox Icon

Free-Install-VirtualBox-Elementary-OS-Juno

Click on Free to start the VirtualBox Installation,

Virtualbox-Installation-Progress-ElementaryOS

Once it has been installed successfully, close the AppCentre

Access VirtualBox / Start VirtualBox

Go to applications –> search virtual box –> click on virtual box icon

Access-VirtualBox-ElementaryOS-Juno

Above screen confirms that VirtualBox 5.2.10 has been installed successfully. Now let’s install VirtualBox 5.2.10 Extension pack,

Installation of VirtualBox Extension Pack

Extension pack provides the additional functionalities to your VirtualBox like support for USB 2.0 & 3.0, PXE boot for Intel cards, VirtualBox RDP and disk encryption.

To Install the extension pack, first find the exact version of your virtualbox, in our case it is 5.2.10, now go to URL and download the extension pack file to your elementary system.

https://www.virtualbox.org/wiki/Download_Old_Builds_5_2

Download-VirtualBox-Extension-Pack-ElementaryOS

Click on Ok to download the Extension pack directly to VirtualBox,

Install-VirtualBox-Extension-Pack-ElementaryOS-Juno

Click on “Install” to install the VirtualBox Extension Pack. Accept the License and then click on I Agree to finish the installation.

VirtualBox-ExtensionPack-Successfull-Installation-ElementaryOS

This confirm that VirtualBox Extension Pack has been installed successfully. Now start creating the virtual machines and have fun 😊.

How to Install and Configure FreeIPA on CentOS 7 Server

$
0
0

FreeIPA is a free and open source identity management tool, it is the upstream project for Red Hat identity manager. Using FreeIPA tool, we can easily manage centralized authentication along with account management, policy (host-based access control) and audit. FreeIPA also provides the services like DNS and PKI.

FreeIPA is based on the following Open Source projects,

  • 389 Directory Server(LDAP)
  • MIT Kerberos
  • SSSD
  • Dogtag (Certificate System)
  • NTP & DNS

FreeIP-CentOS7

In this article we will demonstrate how to install and configure FreeIPA tool on CentOS 7 Server. Following are the details of my test Lab Server (CentOS7),

  • IP Address = 192.168.0.102
  • Hostanme = ipa.linuxtechi.lan
  • RAM = 2 GB
  • CPU =2 vCPU
  • Disk = 12 GB free space on /
  • Internet Connection

Step:1 Set static Hostname and apply updates

Set the static host name of your server using the hostnamectl command,

[root@localhost ~]# hostnamectl set-hostname "ipa.linuxtechi.lan"
[root@localhost ~]# exec bash
[root@ipa ~]#

Update the server using yum update command and then reboot it

[root@ipa ~]# yum update -y;reboot

Step:2 Update the hosts file (/etc/hosts)

Run the below echo command to update /etc/hosts file, replace the ip address and hostname as per your setup.

[root@ipa ~]# echo -e "192.168.0.102\tipa.linuxtechi.lan\t ip" >> /etc/hosts
[root@ipa ~]#

Step:3 Install FreeIPA packages using yum command

FreeIPA packages and its dependencies are available in the default package repositories. As we are planning to install integrated DNS of FreeIPA, so we will also install “ipa-server-dns

Run the below command to install FreeIPA and its dependencies

[root@ipa ~]# yum install ipa-server ipa-server-dns -y

Step:4 Start the FreeIPA Installation setup using “ipa-server-install”

Once the packages are installed successfully then use the below command to start the freeipa installation setup,

It will prompt couple of things like to configure Integrated DNS, Host name, Domain Name and Realm Name

[root@ipa ~]# ipa-server-install

Output of above command would be something like below

FreeIPA-Server-Install-part1

FreeIPA-Server-Install-part2

After pressing yes in above window, it will take some time to configure your FreeIPA server and once it has been setup successfully then we will get output something like below,

FreeIPA-Server-Install-part3

Above output confirms that it has been installed successfully.

Run the below command to allow User’s home directory creation automatically after authentication (or login)

[root@ipa ~]# authconfig --enablemkhomedir --update
[root@ipa ~]#

Note: In case you get the below errors while installing FreeIPA on CentOS 7 server,

.............
[error] CalledProcessError: Command '/bin/systemctl start certmonger.service' returned non-zero exit status 1
ipa.ipapython.install.cli.install_tool(CompatServerMasterInstall): ERROR    Command '/bin/systemctl start certmonger.service' returned non-zero exit status 1
ipa.ipapython.install.cli.install_tool(CompatServerMasterInstall): ERROR    The ipa-server-install command failed. See /var/log/ipaserver-install.log for more information
.................

This seems to be known issue on CentOS 7, so to resolve this we have restart dbus service (service dbus restart) and uninstall freeipa using the command “ipa-server-install –uninstall” and then again try to install.

Step:5 Allow FreeIPA ports in OS Firewall

In case OS firewall is running on your centos 7 server then run the beneath firewall-cmd commands to allow or open ports for FreeIPA,

[root@ipa ~]# firewall-cmd --add-service=freeipa-ldap
success
[root@ipa ~]# firewall-cmd --add-service=freeipa-ldap --permanent
success
[root@ipa ~]# firewall-cmd --reload
success
[root@ipa ~]#

Step:6 Verification & Access FreeIPA admin portal

Use the below command to check whether all services of FreeIPA are running or not

[root@ipa ~]# ipactl status
Directory Service: RUNNING
krb5kdc Service: RUNNING
kadmin Service: RUNNING
named Service: RUNNING
httpd Service: RUNNING
ipa-custodia Service: RUNNING
ntpd Service: RUNNING
pki-tomcatd Service: RUNNING
ipa-otpd Service: RUNNING
ipa-dnskeysyncd Service: RUNNING
ipa: INFO: The ipactl command was successful
[root@ipa ~]#

Let’s verify whether admin user will get token via Kerberos using the kinit command, use the same password of admin user that we supplied during FreeIPA installation.

[root@ipa ~]# kinit admin
Password for admin@LINUXTECHI.LAN:
[root@ipa ~]# klist
Ticket cache: KEYRING:persistent:0:0
Default principal: admin@LINUXTECHI.LAN
Valid starting       Expires              Service principal
11/26/2018 07:39:00  11/27/2018 07:38:55  krbtgt/LINUXTECHI.LAN@LINUXTECHI.LAN
[root@ipa ~]#

Access the FreeIPA admin portal using the URL:

https://ipa.linuxtechi.lan/ipa/ui

Use the user name as admin and the password that we specify during the installation.

FreeIPA-Login-Page-CentOS7

Click on Login

FreeIPA-Admin-Portal-Dashboard-CentOS7

This confirms that we have successfully setup FreeIPA on CentOS 7 Server. It also conclude the article, please do share your feedback and comments.

Read More on : How to Configure FreeIPA Client on Ubuntu 18.04 / CentOS 7 for Centralize Authentication

How to Configure FreeIPA Client on Ubuntu 18.04 / CentOS 7 for Centralize Authentication

$
0
0

In our previous article we have already discussed about FreeIPA and its installation steps on CentOS 7 Server, in this article we will discuss how an Ubuntu 18.04 and CentOS 7 machine can be integrated to FreeIPA Server for centralize authentication.

FreeIPA-client-CentOS7-Ubuntu18Read More: How to Install and Configure FreeIPA on CentOS 7 Server

I am assuming “sysadm” user is already created on FreeIPA Sever for Linux Systems for centralize authentication, if not then execute the below commands from FreeIPA server to create the user,

[root@ipa ~]# kinit admin
Password for admin@LINUXTECHI.LAN:
[root@ipa ~]# ipa config-mod --defaultshell=/bin/bash
[root@ipa ~]# ipa user-add sysadm --first=System --last=Admin --password
Password:
Enter Password again to verify:
-------------------
Added user "sysadm"
-------------------
  User login: sysadm
  First name: System
  Last name: Admin
  Full name: System Admin
  Display name: System Admin
  Initials: SA
  Home directory: /home/sysadm
  GECOS: System Admin
  Login shell: /bin/bash
  Principal name: sysadm@LINUXTECHI.LAN
  Principal alias: sysadm@LINUXTECHI.LAN
  User password expiration: 20181118194031Z
  Email address: sysadm@linuxtechi.lan
  UID: 1285200003
  GID: 1285200003
  Password: True
  Member of groups: ipausers
  Kerberos keys available: True
[root@ipa ~]#

First command is to get Kerberos credentials and second command to set default login shell for all users as “/bin/bash” and third command used for creating the user with name “sysadm

Steps to configure FreeIPA Client on Ubuntu 18.04 system

Step:1) Add DNS record of Ubuntu 18.04 system on FreeIPA Server

Login to your FreeIPA Server( In my case it is installed on CentOS 7) and run the beneath command to add dns record for FreeIPA client (i.e Ubuntu 18.04 system)

[root@ipa ~]# ipa dnsrecord-add linuxtechi.lan app01.linuxtechi.lan --a-rec 192.168.1.106
  Record name: app01.linuxtechi.lan
  A record: 192.168.1.106
[root@ipa ~]#

In the above command app01.linuxtechi.lan is my Ubuntu 18.04 system with IP address 192.168.1.106.

Note: Make sure your FreeIPA Server and Clients are on the same timezone and getting the time from NTP Servers.

Step:2) Install FreeIPA client Packages using apt-get command

Run the below command from your ubuntu system to install freeipa-client along with the dependencies,

pkumar@app01:~$ sudo apt-get install freeipa-client oddjob-mkhomedir -y

While installing the freeipa-client, we will below screen, Hit enter to Skip

FreeIPA-Client-Kerberos-Ubuntu18

Step:3) Update /etc/hosts file of FreeIPA client (Ubuntu 18.04)

Add below entries of your FreeIPA Server in /etc/hosts file

pkumar@app01:~$ echo "192.168.1.105 ipa.linuxtechi.lan ipa" | sudo tee -a /etc/hosts

Change IP address and hostname that suits to your setup.

Step:4) Configure FreeIPA client using command ‘ipa-client-install’

Now run “ipa-client-install” command to configure freeipa-client on your ubuntu 18.04 system,

pkumar@app01:~$ sudo ipa-client-install --hostname=`hostname -f` --mkhomedir --server=ipa.linuxtechi.lan --domain linuxtechi.lan --realm LINUXTECHI.LAN

Change the FreeIPA Server address, domain name and realm that suits to your setup.

Output of above command would be something like below :

ipa-client-install-ubuntu18-part1

ipa-client-install-ubuntu18-part2

Now allow user’s home direction to be created automatically when they first time authenticated with FreeIPA Server.

Append the following line in the file “/usr/share/pam-configs/mkhomedir”

required pam_mkhomedir.so umask=0022 skel=/etc/skel

pkumar@app01:~$ echo "required pam_mkhomedir.so umask=0022 skel=/etc/skel" | sudo tee -a /usr/share/pam-configs/mkhomedir

Apply the above changes using following command,

Update-PAM-Ubuntu18

Select OK and then hit enter,

Now try to login or ssh to your Ubuntu 18.04 system with sysadm user.

Step:5) Try to Login to your Ubuntu 18.04 System with sysadm user

Now ssh to your ubuntu 18.04 system using the sysadm user,

# ssh sysadm@192.168.1.106
sysadm@192.168.1.106's password:
X11 forwarding request failed on channel 0
Password expired. Change your password now.
Creating directory '/home/sysadm'.
Welcome to Ubuntu 18.04 LTS (GNU/Linux 4.15.0-20-generic x86_64)
 * Documentation:  https://help.ubuntu.com
 * Management:     https://landscape.canonical.com
 * Support:        https://ubuntu.com/advantage
 * Canonical Livepatch is available for installation.
   - Reduce system reboots and improve kernel security. Activate at:
     https://ubuntu.com/livepatch
418 packages can be updated.
166 updates are security updates.
WARNING: Your password has expired.
You must change your password now and login again!
Current Password:
New password:
Retype new password:
passwd: password updated successfully
Connection to 192.168.1.106 closed.

As we can see, at the first time authentication, it will prompt us to set the new password as the password is expired and will disconnect that session.

Now try to ssh ubuntu system and this time we should able to connect,

# ssh sysadm@192.168.1.106
Welcome to Ubuntu 18.04 LTS (GNU/Linux 4.15.0-20-generic x86_64)
Last login: Sat Dec  8 21:37:44 2018 from 192.168.1.101
/usr/bin/xauth:  timeout in locking authority file /home/sysadm/.Xauthority
sysadm@app01:~$
sysadm@app01:~$ id
uid=1285200003(sysadm) gid=1285200003(sysadm) groups=1285200003(sysadm)
sysadm@app01:~$

This confirms that we have successfully configure FreeIPA Client on Ubuntu 18.04 system.

Steps to configure FreeIPA Client on CentOS 7 System

Step:1) Add DNS record of CentOS 7 on FreeIPA Server

Run the following command from FreeIPA server,

[root@ipa ~]# ipa dnsrecord-add linuxtechi.lan db01.linuxtechi.lan --a-rec 192.168.1.103
  Record name: db01.linuxtechi.lan
  A record: 192.168.1.103
[root@ipa ~]#

Step:2) Add the FreeIPA Server details in /etc/hosts

Login to your centos 7 system and add the following in /etc/hosts file

[root@db01 ~]# echo "192.168.1.105 ipa.linuxtechi.lan ipa" >> /etc/hosts
[root@db01 ~]# echo "192.168.0.103 db01.linuxtechi.lan" >> /etc/hosts

Step:3 Install and Configure FreeIPA Client

Use the below command to install FreeIPA client on CentOS 7 system,

[root@db01 ~]# yum install freeipa-client -y

Now configure FreeIPA client using “ipa-client-install” command,

[root@db01 ~]# ipa-client-install --hostname=`hostname -f` --mkhomedir --server=ipa.linuxtechi.lan --domain linuxtechi.lan --realm LINUXTECHI.LAN

Use the same details and credentials that we have used while the same command in Ubuntu 18.04 system

If the above command is executed successfully then we should the output something like below,

………………………………………………
[try 1]: Forwarding 'host_mod' to json server 'https://ipa.linuxtechi.lan/ipa/session/json'
Could not update DNS SSHFP records.
SSSD enabled
Configured /etc/openldap/ldap.conf
Configured /etc/ssh/ssh_config
Configured /etc/ssh/sshd_config
Configuring linuxtechi.lan as NIS domain.
Client configuration complete.
The ipa-client-install command was successful
[root@db01 ~]#

Run the below command so that User’s home directory is created automatically at the first login,

[root@db01 ~]# authconfig --enablemkhomedir --update
[root@db01 ~]#

Now you should able to login to CentOS 7 system with sysadm user.

Steps to uninstall FreeIPA Client from Ubuntu 18.04 / CentOS 7

[root@db01 ~]# ipa-client-install --uninstall
[root@db01 ~]# rm -rf /var/lib/sss/db/*
[root@db01 ~]# systemctl restart sssd.service

That’s all from this article, please do share your feedback and comments.

How to Generate sosreport on Ubuntu 18.04 / Debian 9 Server

$
0
0

SOS is a tool which is used to collect all the system configuration, logs and diagnostic information and archive it into a single file. Sosreport is generally required for technical support engineers and developers to identify fault and sometimes it is also used for debugging purpose.

Generate-sosreport-ubuntu-debian-server

Following are the scenarios where we are required to generate sosreport:

  • Server got crashed and to find the RCA for crash
  • Server performance got degraded
  • Application performance degraded

SOS tool is available for most of the Linux distributions (RHEL, CentOS, Ubuntu, Debian & SUSE). In this tutorial we will discuss how to generate SOS report on Ubuntu 18.04 and Debian 9 Sever,

Note: By default, SOS package is the part of default installation of Ubuntu 18.04 and Debian 9 Server.

Generating sosreport on Ubuntu 18.04 Server & Debian 9

Login to your server and execute the command “sosreport“.

linuxtechi@ubuntu-server:~$ sudo sosreport

sosreport-command-ubuntu18

Above command will take couple of minutes to generate the report and that report will be compressed as “xz” format. Apart from this, /tmp folder is the default location where sosreport is stored.

While generating the report you can also specify the CASE ID for server fault and your first name and last name.

Generating sosreport in non-interactive mode

To generate the sosreport in non-interactive run the sosreport command followed by “–batch” option

linuxtechi@ubuntu-server:~$ sudo sosreport --batch

Save sosreport to an alternate path or folder

Let’s assume you server has separate /tmp folder and which doesn’t have enough free space in that case you can instruct sosreport command to save the report to other folders using option “–tmp-dir”, example is shown below,

linuxtechi@ubuntu-server:~$ sudo sosreport --tmp-dir /mnt

Generating sosreport in different compression type

Sosreport is archived and compressed using the different compression techniques like gzip, bzip2, xz.

Default compression for sosreport is xz, if you want to use other compression techniques while generating the sosreport, then specify the options “–compression-type“, example is shown below

linuxtechi@ubuntu-server:~$ sudo sosreport --compression-type bzip2

List all plugins for sosreport

If you are interested which plugins are available for sosreport, run the following command

linuxtechi@ubuntu-server:~$ sudo sosreport -l

Generate the sosreport by skipping specific plugins

While generating the sosreport, if you want to skip the data of specific plugin or modules then use “-n” option in sosreport command followed by plugin name

Let’s assume I am want to generate the sosreport but I want to skip udev information in that report, use the following command,

linuxtechi@ubuntu-server:~$ sudo sosreport -n udev --batch

Generating sosreport only for specific plugins or modules

There can be some scenarios where we are required to generate the sosreport of your server only for specific plugins, this can easily be achieved using “-o” option followed by the plugin name,

Sosreport for memory only,

linuxtechi@ubuntu-server:~$ sudo sosreport -o memory --batch

sosreport for memory and kernel plugins,

linuxtechi@ubuntu-server:~$ sudo sosreport -o memory,kernel --batch

That’s all from this article, If you want to read more on sosreport command options refer is man page (man sosreport).

In case if you find this article informative then please do share your feedback and comments.


OpenStack Deployment using Devstack on CentOS 7 / RHEL 7 System

$
0
0

Devstack is a collection of scripts which deploy the latest version of openstack environment on virtual machine, personal laptop or a desktop. As the name suggests it is used for development environment and can be used for Openstack Project’s functional testing and sometime openstack environment deployed by devstack can also be used for demonstrations purpose and for some basic PoC.

Deploy-OpenStack-Devstack

In this article I will demonstrate how to install Openstack on CentOS 7 / RHEL 7 System using Devstack. Following are the minimum system requirements,

  • Dual Core Processor
  • Minimum 8 GB RAM
  • 60 GB Hard Disk
  • Internet Connection

Following are  the details of my Lab Setup for Openstack deployment using devstack

  • Minimal Installed CentOS 7 / RHEL 7 (VM)
  • Hostname – devstack-linuxtechi
  • IP Address – 169.144.104.230
  • 10 vCPU
  • 14 GB RAM
  • 60 GB Hard disk

Let’s start deployment steps, login to your CentOS 7 or RHEL 7 System

Step:1 Update Your System and Set Hostname

Run the following yum command to apply latest updates to system and then take a reboot. Also after reboot set the hostname

~]# yum update -y && reboot
~]# hostnamectl set-hostname "devstack-linuxtechi"
~]# exec bash

Step:2) Create a Stack user and assign sudo rights to it

All the installations steps are to be carried out by a user name “stack“, refer the below commands to create and assign sudo rights .

[root@devstack-linuxtechi ~]# useradd -s /bin/bash -d /opt/stack -m stack
[root@devstack-linuxtechi ~]# echo "stack ALL=(ALL) NOPASSWD: ALL" | sudo tee /etc/sudoers.d/stack
stack ALL=(ALL) NOPASSWD: ALL
[root@devstack-linuxtechi ~]#

Step:3) Install git and download devstack

Switch to stack user and install git package using yum command

[root@devstack-linuxtechi ~]# su - stack
[stack@devstack-linuxtechi ~]$ sudo yum install git -y

Download devstack using below git command,

[stack@devstack-linuxtechi ~]$ git clone https://git.openstack.org/openstack-dev/devstack
Cloning into 'devstack'...
remote: Counting objects: 42729, done.
remote: Compressing objects: 100% (21438/21438), done.
remote: Total 42729 (delta 30283), reused 32549 (delta 20625)
Receiving objects: 100% (42729/42729), 8.93 MiB | 3.77 MiB/s, done.
Resolving deltas: 100% (30283/30283), done.
[stack@devstack-linuxtechi ~]$

Step:4) Create local.conf file and start openstack installation

To start openstack installation using devstack script (stack.sh), first we need to prepare local.conf file that suits to our setup.

Change to devstack folder and create local.conf file with below contents

[stack@devstack-linuxtechi ~]$ cd devstack/
[stack@devstack-linuxtechi devstack]$ vi local.conf
[[local|localrc]]
#Specify the IP Address of your VM / Server in front of HOST_IP Parameter
HOST_IP=169.144.104.230

#Specify the name of interface of your Server or VM in front of FLAT_INTERFACE
FLAT_INTERFACE=eth0

#Specify the Tenants Private Network and its Size
FIXED_RANGE=10.4.128.0/20
FIXED_NETWORK_SIZE=4096

#Specify the range of external IPs that will be used in Openstack for floating IPs
FLOATING_RANGE=172.24.10.0/24

#Number Host on which Openstack will be deployed
MULTI_HOST=1

#Installation Logs file
LOGFILE=/opt/stack/logs/stack.sh.log

#KeyStone Admin Password / Database / RabbitMQ / Service Password
ADMIN_PASSWORD=openstack
DATABASE_PASSWORD=db-secret
RABBIT_PASSWORD=rb-secret
SERVICE_PASSWORD=sr-secret

#Additionally installing Heat Service
enable_plugin heat https://git.openstack.org/openstack/heat master
enable_service h-eng h-api h-api-cfn h-api-cw

Save and exit the file.

Now start the deployment or installation by executing the script (stack.sh)

[stack@devstack-linuxtechi devstack]$ ./stack.sh

It will take between 30 to 45 minutes depending upon your internet connection.

While running the above command, if you got the below errors

+functions-common:git_timed:607            timeout -s SIGINT 0 git clone git://git.openstack.org/openstack/requirements.git /opt/stack/requirements --branch master
fatal: unable to connect to git.openstack.org:
git.openstack.org[0: 104.130.246.85]: errno=Connection timed out
git.openstack.org[1: 2001:4800:7819:103:be76:4eff:fe04:77e6]: errno=Network is unreachable
Cloning into '/opt/stack/requirements'...
+functions-common:git_timed:610            [[ 128 -ne 124 ]]
+functions-common:git_timed:611            die 611 'git call failed: [git clone' git://git.openstack.org/openstack/requirements.git /opt/stack/requirements --branch 'master]'
+functions-common:die:195                  local exitcode=0
[Call Trace]
./stack.sh:758:git_clone
/opt/stack/devstack/functions-common:547:git_timed
/opt/stack/devstack/functions-common:611:die
[ERROR] /opt/stack/devstack/functions-common:611 git call failed: [git clone git://git.openstack.org/openstack/requirements.git /opt/stack/requirements --branch master]
Error on exit
/bin/sh: brctl: command not found
[stack@devstack-linuxtechi devstack]$

To Resolve these errors, perform the following steps

Install bridge-utils package and change parameter from “GIT_BASE=${GIT_BASE:-git://git.openstack.org}” to “GIT_BASE=${GIT_BASE:-https://www.github.com}” in stackrc file

[stack@devstack-linuxtechi devstack]$ sudo yum install bridge-utils -y
[stack@devstack-linuxtechi devstack]$ vi stackrc
……
#GIT_BASE=${GIT_BASE:-git://git.openstack.org}
GIT_BASE=${GIT_BASE:-https://www.github.com}
……

Now re-run the stack.sh script,

[stack@devstack-linuxtechi devstack]$ ./stack.sh

Once the script is executed successfully, we will get the output something like below,

Stack-Command-output-CentOS7

This confirms that openstack has been deployed successfully,

Step:5 Access OpenStack either via Openstack CLI or Horizon Dashboard

if you want to perform any task from openstack cli, then you have to firsr source openrc file, which contain admin credentials.

[stack@devstack-linuxtechi devstack]$ source openrc
WARNING: setting legacy OS_TENANT_NAME to support cli tools.
[stack@devstack-linuxtechi devstack]$ openstack network list
+--------------------------------------+---------+----------------------------------------------------------------------------+
| ID                                   | Name    | Subnets                                                                    |
+--------------------------------------+---------+----------------------------------------------------------------------------+
| 5ae5a9e3-01ac-4cd2-86e3-83d079753457 | private | 9caa54cc-f5a4-4763-a79e-6927999db1a1, a5028df6-4208-45f3-8044-a7476c6cf3e7 |
| f9354f80-4d38-42fc-a51e-d3e6386b0c4c | public  | 0202c2f3-f6fd-4eae-8aa6-9bd784f7b27d, 18050a8c-41e5-4bae-8ab8-b500bc694f0c |
+--------------------------------------+---------+----------------------------------------------------------------------------+
[stack@devstack-linuxtechi devstack]$ openstack image list
+--------------------------------------+--------------------------+--------+
| ID                                   | Name                     | Status |
+--------------------------------------+--------------------------+--------+
| 5197ed8e-39d2-4eca-b36a-d38381b57adc | cirros-0.3.6-x86_64-disk | active |
+--------------------------------------+--------------------------+--------+
[stack@devstack-linuxtechi devstack]$

Now Try accessing the Horizon Dashboard, URL details and Credentials are already there in stack command output.

http://{Your-Server-IP-Address}/dashboard

Login-OpenStack-Dashboard-DevStack-CentOS7

Horizon-Dashboard-DevStack-CentOS7

Remove/ Uninstall OpenStack using devstack scripts

If are done with testing and demonstration and want to remove openstack from your system then run the followings scripts via Stack user,

[stack@devstack-linuxtechi ~]$ cd devstack
[stack@devstack-linuxtechi devstack]$ ./clean.sh
[stack@devstack-linuxtechi devstack]$ ./unstack.sh
[stack@devstack-linuxtechi devstack]$ rm -rf /opt/stack/
[stack@devstack-linuxtechi ~]$ sudo rm -rf devstack
[stack@devstack-linuxtechi ~]$ sudo rm -rf /usr/local/bin/

That’s all from this tutorial, if you like the steps, please do share your valuable feedback and comments.

How to Resize OpenStack Instance (Virtual Machine) from Command line

$
0
0

Being a Cloud administrator, resizing or changing resources of an instance or virtual machine is one of the most common tasks.

Resize-openstack-instance

In Openstack environment, there are some scenarios where cloud user has spin a vm using some flavor( like m1.smalll) where root partition disk size is 20 GB, but at some point of time user wants to extends the root partition size to 40 GB. So resizing of vm’s root partition can be accomplished by using the resize option in nova command. During the resize, we need to specify the new flavor that will include disk size as 40 GB.

Note: Once you extend the instance resources like RAM, CPU and disk using resize option in openstack then you can’t reduce it.

Read More on : How to Create and Delete Virtual Machine(VM) from Command line in OpenStack

In this tutorial I will demonstrate how to resize an openstack instance from command line. Let’s assume I have an existing instance named “test_resize_vm” and it’s associated flavor is “m1.small” and root partition disk size is 20 GB.

Execute the below command from controller node to check on which compute host our vm “test_resize_vm” is provisioned and its flavor details

:~# openstack server show test_resize_vm | grep -E "flavor|hypervisor"
| OS-EXT-SRV-ATTR:hypervisor_hostname  | compute-57    |
| flavor                               | m1.small (2)  |
:~#

Login to VM as well and check the root partition size,

[root@test-resize-vm ~]# df -Th
Filesystem     Type      Size  Used Avail Use% Mounted on
/dev/vda1      xfs        20G  885M   20G   5% /
devtmpfs       devtmpfs  900M     0  900M   0% /dev
tmpfs          tmpfs     920M     0  920M   0% /dev/shm
tmpfs          tmpfs     920M  8.4M  912M   1% /run
tmpfs          tmpfs     920M     0  920M   0% /sys/fs/cgroup
tmpfs          tmpfs     184M     0  184M   0% /run/user/1000
[root@test-resize-vm ~]# echo "test file for resize operation" > demofile
[root@test-resize-vm ~]# cat demofile
test file for resize operation
[root@test-resize-vm ~]#

Get the available flavor list using below command,

:~# openstack flavor list
+--------------------------------------+-----------------+-------+------+-----------+-------+-----------+
| ID                                   | Name            |   RAM | Disk | Ephemeral | VCPUs | Is Public |
+--------------------------------------+-----------------+-------+------+-----------+-------+-----------+
| 2                                    | m1.small        |  2048 |   20 |         0 |     1 | True      |
| 3                                    | m1.medium       |  4096 |   40 |         0 |     2 | True      |
| 4                                    | m1.large        |  8192 |   80 |         0 |     4 | True      |
| 5                                    | m1.xlarge       | 16384 |  160 |         0 |     8 | True      |
+--------------------------------------+-----------------+-------+------+-----------+-------+-----------+

So we will be using the flavor “m1.medium” for resize operation, Run the beneath nova command to resize “test_resize_vm”,

Syntax: # nova resize {VM_Name}  {flavor_id}  —poll

:~# nova resize test_resize_vm 3 --poll
Server resizing... 100% complete
Finished
:~#

Now confirm the resize operation using “openstack server –confirm” command,

~# openstack server list | grep -i test_resize_vm
| 1d56f37f-94bd-4eef-9ff7-3dccb4682ce0 | test_resize_vm | VERIFY_RESIZE |private-net=10.20.10.51                                  |
:~#

As we can see in the above command output  the current status of the vm is “verify_resize“, execute below command to confirm resize,

~# openstack server resize --confirm 1d56f37f-94bd-4eef-9ff7-3dccb4682ce0
~#

After the resize confirmation, status of VM will become active, now re-verify hypervisor and flavor details for the vm

:~# openstack server show test_resize_vm | grep -E "flavor|hypervisor"
| OS-EXT-SRV-ATTR:hypervisor_hostname  | compute-58   |
| flavor                               | m1.medium (3)|

Login to your VM now and verify the root partition size

[root@test-resize-vm ~]# df -Th
Filesystem     Type      Size  Used Avail Use% Mounted on
/dev/vda1      xfs        40G  887M   40G   3% /
devtmpfs       devtmpfs  1.9G     0  1.9G   0% /dev
tmpfs          tmpfs     1.9G     0  1.9G   0% /dev/shm
tmpfs          tmpfs     1.9G  8.4M  1.9G   1% /run
tmpfs          tmpfs     1.9G     0  1.9G   0% /sys/fs/cgroup
tmpfs          tmpfs     380M     0  380M   0% /run/user/1000
[root@test-resize-vm ~]# cat demofile
test file for resize operation
[root@test-resize-vm ~]#

This confirm that VM root partition has been resized successfully.

Note: Due to some reason if resize operation was not successful and you want to revert the vm back to previous state, then run the following command,

# openstack server resize --revert {instance_uuid}

If have noticed “openstack server show” commands output, VM is migrated from compute-57 to compute-58 after resize. This is the default behavior  of “nova resize” command ( i.e nova resize command will migrate the instance to another compute & then resize it based on the flavor details)

In case if you have only one compute node then nova resize will not work, but we can make it work by changing the below parameter in nova.conf file on compute node,

Login to compute node, verify the parameter value

[root@devstack-linuxtechi ~]# grep -i resize /etc/nova/nova.conf
allow_resize_to_same_host = True
[root@devstack-linuxtechi ~]#

If “allow_resize_to_same_host” is set as False then change it to True and restart the nova compute service.

Read More on OpenStack Deployment using Devstack on CentOS 7 / RHEL 7 System

That’s all from this tutorial, in case it helps you technically then please do share your feedback and comments.

Install and Configure Kubernetes (k8s) 1.13 on Ubuntu 18.04 LTS / Ubuntu 18.10

$
0
0

Kubernetes is a free and open source container orchestration tool. It is used to deploy container based applications automatically in cluster environment, apart from this it also used to manage Docker containers across the kubernetes cluster hosts. Kubernetes is also Known as K8s.

Install-Kubernetes-Ubuntu-18-04

In this article I will demonstrate how to install and configure two node Kubernetes (1.13) using kubeadm on Ubuntu 18.04 / 18.10 systems. Following are the details of my lab setup:

I will be using three Ubuntu 18.04 LTS system, where one system will act as Kubernetes Master Node and other two nodes will act as Slave node and will join the Kubernetes cluster. I am assuming minimal 18.04 LTS is installed on these three systems.

  • Kubernetes Master Node – (Hostname: k8s-master , IP : 192.168.1.70, OS : Minimal Ubuntu 18.04 LTS)
  • Kubernetes Slave Node 1 – (Hostname: k8s-worker-node1, IP: 192.168.1.80 , OS : Minimal Ubuntu 18.04 LTS)
  • Kubernetes Slave Node 2 – (Hostname: k8s-worker-node2, IP: 192.168.1.90 , OS : Minimal Ubuntu 18.04 LTS)

Note: Kubernetes Slave Node is also known as Worker Node

Let’s jump into the k8s installation and configuration steps.

Step:1) Set Hostname and update hosts file

Login to the master node and configure its hostname using the hostnamectl command

linuxtechi@localhost:~$ sudo hostnamectl set-hostname "k8s-master"
linuxtechi@localhost:~$ exec bash
linuxtechi@k8s-master:~$

Login to Slave / Worker Nodes and configure their hostname respectively using the hostnamectl command,

linuxtechi@localhost:~$ sudo hostnamectl set-hostname k8s-worker-node1
linuxtechi@localhost:~$ exec bash
linuxtechi@k8s-worker-node1:~$

linuxtechi@localhost:~$ sudo hostnamectl set-hostname k8s-worker-node2
linuxtechi@localhost:~$ exec bash
linuxtechi@k8s-worker-node2:~$

Add the following lines in /etc/hosts file on all three systems,

192.168.1.70     k8s-master
192.168.1.80     k8s-worker-node1
192.168.1.90     k8s-worker-node2

Step:2) Install and Start Docker Service on Master and Slave Nodes

Run the below apt-get command to install Docker on Master node,

linuxtechi@k8s-master:~$ sudo apt-get install docker.io -y

Run the below apt-get command to install docker on slave nodes,

linuxtechi@k8s-worker-node1:~$ sudo apt-get install docker.io -y
linuxtechi@k8s-worker-node2:~$ sudo apt-get install docker.io -y

Once the Docker packages are installed on all the three systems , start and enable the docker service using below systemctl commands, these commands needs to be executed on master and slave nodes.

~$ sudo systemctl start docker
~$ sudo systemctl enable docker
Synchronizing state of docker.service with SysV service script with /lib/systemd/systemd-sysv-install.
Executing: /lib/systemd/systemd-sysv-install enable docker
~$

Use below docker command to verify which Docker version has been installed on these systems,

~$ docker --version
Docker version 18.06.1-ce, build e68fc7a
~$

Step:3) Configure Kubernetes Package Repository on Master & Slave Nodes

Note: All the commands in this step are mandate to run on master and slave nodes

Let’s first install some required packages, run the following commands on all the nodes including master node

~$ sudo apt-get install apt-transport-https curl -y

Now add Kubernetes package repository key using the following command,

:~$ curl -s https://packages.cloud.google.com/apt/doc/apt-key.gpg | sudo apt-key add
OK
:~$

Now configure Kubernetes repository using below apt commands, at this point of time Ubuntu 18.04 (bionic weaver) Kubernetes package repository is not available, so we will be using Xenial Kubernetes package repository.

:~$ sudo apt-add-repository "deb http://apt.kubernetes.io/ kubernetes-xenial main"

Step:4) Disable Swap and Install Kubeadm on all the nodes

Note: All the commands in this step are mandate to run on master and slave nodes

Kubeadm is one of the most common method used to deploy kubernetes cluster or in other words we can say it used to deploy multiple nodes on a kubernetes cluster.

As per the Kubernetes Official web site, it is recommended to disable swap on all the nodes including master node.

Run the following command to disable swap temporary,

:~$ sudo swapoff -a

For permanent swap disable, comment out swapfile or swap partition entry in the /etc/fstab file.

Now Install Kubeadm package on all the nodes including master.

:~$ sudo apt-get install kubeadm -y

Once kubeadm packages are installed successfully, verify the kubeadm version using beneath command.

:~$ kubeadm version
kubeadm version: &version.Info{Major:"1", Minor:"13", GitVersion:"v1.13.2", GitCommit:"cff46ab41ff0bb44d8584413b598ad8360ec1def", GitTreeState:"clean", BuildDate:"2019-01-10T23:33:30Z", GoVersion:"go1.11.4", Compiler:"gc", Platform:"linux/amd64"}
:~$

Step:5) Initialize and Start Kubernetes Cluster on Master Node using Kubeadm

Use the below kubeadm command on Master Node only to initialize Kubernetes

linuxtechi@k8s-master:~$ sudo kubeadm init --pod-network-cidr=172.168.10.0/24

In the above command you can use the same pod network or choose your own pod network that suits to your environment. Once the command is executed successfully, we will get the output something like below,

Kubeadm-Command-Output-Ubuntu18

Above output confirms that Master node has been initialized successfully, so to start the cluster run the beneath commands one after the another,

linuxtechi@k8s-master:~$  mkdir -p $HOME/.kube
linuxtechi@k8s-master:~$ sudo cp -i /etc/kubernetes/admin.conf $HOME/.kube/config
linuxtechi@k8s-master:~$ sudo chown $(id -u):$(id -g) $HOME/.kube/config
linuxtechi@k8s-master:~$

Verify the status of master node using the following command,

linuxtechi@k8s-master:~$ kubectl get nodes
NAME         STATUS     ROLES    AGE   VERSION
k8s-master   NotReady   master   18m   v1.13.2
linuxtechi@k8s-master:~$

As we can see in the above command output that our master node is not ready because as of now we have not deployed any pod.

Let’s deploy the pod network, Pod network is the network through which our cluster nodes will communicate with each other. We will deploy Flannel as our pod network, Flannel will provide the overlay network between cluster nodes.

Step:6) Deploy Flannel as Pod Network from Master node and verify pod namespaces

Execute the following kubectl command to deploy pod network from master node

linuxtechi@k8s-master:~$ sudo kubectl apply -f https://raw.githubusercontent.com/coreos/flannel/master/Documentation/kube-flannel.yml

Output of above command should be something like below

clusterrole.rbac.authorization.k8s.io/flannel created
clusterrolebinding.rbac.authorization.k8s.io/flannel created
serviceaccount/flannel created
configmap/kube-flannel-cfg created
daemonset.extensions/kube-flannel-ds-amd64 created
daemonset.extensions/kube-flannel-ds-arm64 created
daemonset.extensions/kube-flannel-ds-arm created
daemonset.extensions/kube-flannel-ds-ppc64le created
daemonset.extensions/kube-flannel-ds-s390x created
linuxtechi@k8s-master:~$

Now verify the master node status and pod namespaces using kubectl command,

linuxtechi@k8s-master:~$ sudo  kubectl get nodes
NAME         STATUS   ROLES    AGE   VERSION
k8s-master   Ready    master   78m   v1.13.2
linuxtechi@k8s-master:~$

linuxtechi@k8s-master:~$ sudo  kubectl get pods --all-namespaces
NAMESPACE     NAME                                 READY   STATUS    RESTARTS   AGE
kube-system   coredns-86c58d9df4-px4sj             1/1     Running   0          79m
kube-system   coredns-86c58d9df4-wzdzk             1/1     Running   0          79m
kube-system   etcd-k8s-master                      1/1     Running   1          79m
kube-system   kube-apiserver-k8s-master            1/1     Running   1          79m
kube-system   kube-controller-manager-k8s-master   1/1     Running   1          79m
kube-system   kube-flannel-ds-amd64-9tn8z          1/1     Running   0          14m
kube-system   kube-proxy-cjzz2                     1/1     Running   1          79m
kube-system   kube-scheduler-k8s-master            1/1     Running   1          79m
linuxtechi@k8s-master:~$

As we can see in the above output our master node status has changed to “Ready” and all the namespaces of pod are in running state, so this confirms that our master node is in healthy state and ready to form a cluster.

Step:7) Add Slave or Worker Nodes to the Cluster

Note: In Step 5, kubeadm command output we got complete command which we will have to use on slave or worker node to join a cluster

Login to first slave node (k8s-worker-node1) and run the following command to join the cluster,

linuxtechi@k8s-worker-node1:~$ sudo kubeadm join 192.168.1.70:6443 --token cwxswk.hbkuu4jua82o80d1 --discovery-token-ca-cert-hash sha256:ff1b0cfe5aec94f90a42bdb45d2b8bfde34006017c0e3f3026a84388f46a5495

Output of above command should be something like this,

kubeadm-join-command-output-worker-node1

Similarly run the same kubeadm join command on the second worker node,

linuxtechi@k8s-worker-node2:~$ sudo kubeadm join 192.168.1.70:6443 --token cwxswk.hbkuu4jua82o80d1 --discovery-token-ca-cert-hash sha256:ff1b0cfe5aec94f90a42bdb45d2b8bfde34006017c0e3f3026a84388f46a5495

Output of above should be something like below,

kubeadm-join-command-output-worker-node2

Now go to master node and run below command to check master and slave node status

linuxtechi@k8s-master:~$ kubectl get nodes
NAME               STATUS   ROLES    AGE    VERSION
k8s-master         Ready    master   100m   v1.13.2
k8s-worker-node1   Ready    <none>   10m    v1.13.2
k8s-worker-node2   Ready    <none>   4m6s   v1.13.2
linuxtechi@k8s-master:~$

Above command confirm that we have successfully added our two worker nodes in the cluster and their state is Ready.This concludes that we have successfully installed and configured two node Kubernetes cluster on Ubuntu 18.04 systems.

Read More on: Deploy Pod, Replication Controller and Service in Kubernetes

Quick guide to Install and Configure Ceph (Distributed Storage) Cluster on CentOS 7

$
0
0

Ceph is free and open source distributed storage solution through which we can easily provide and manage block storage, object storage and file storage. Ceph storage solution can be used in traditional IT infrastructure for providing the centralize storage, apart from this it also used in private cloud (OpenStack & Cloudstack). In Red Hat OpenStack Ceph is used as cinder backend.

Install-Configure-Ceph-Cluster-CentOS7

In this article, we will demonstrate how to install and configure Ceph Cluster(Mimic) on CentOS 7 Servers.

In Ceph Cluster following are the major components:

  • Monitors (ceph-mon) : As the name suggests a ceph monitor nodes keep an eye on cluster state, OSD Map and Crush map
  • OSD ( Ceph-osd): These are the nodes which are part of cluster and provides data store, data replication and recovery functionalities. OSD also provides information to monitor nodes.
  • MDS (Ceph-mds) : It is a ceph meta-data server and stores the meta data of ceph file systems like block storage.
  • Ceph Deployment Node : It is used to deploy the Ceph cluster, it is also called as Ceph-admin or Ceph-utility node.

My Lab setup details :

  • Ceph Deployment Node: (Minimal CentOS 7, RAM: 4 GB, vCPU: 2, IP: 192.168.1.30, Hostname: ceph-controller)
  • OSD or Ceph Compute 1: (Minimal CentOS 7, RAM: 10 GB, vCPU: 4, IP: 192.168.1.31, Hostname: ceph-compute01)
  • OSD or Ceph Compute 2: (Minimal CentOS 7, RAM: 10 GB, vCPU: 4, IP: 192.168.1.32, Hostname: ceph-compute02)
  • Ceph Monitor: (Minimal CentOS 7, RAM: 10 GB, vCPU: 4, IP: 192.168.1.33, Hostname: ceph-monitor)

Note: In all the nodes we have attached two nics (eth0 & eth1), on eth0 IP from the VLAN 192.168.1.0/24 is assigned . On eth1 IP from VLAN 192.168.122.0/24 is assigned and will provide the internet access.

Let’s Jump into the installation and configuration steps:

Step:1) Update /etc/hosts file, NTP, Create User & Disable SELinux on all Nodes

Add the following lines in /etc/hosts file of all the nodes so that one can access these nodes via their hostname as well.

192.168.1.30    ceph-controller
192.168.1.31    ceph-compute01
192.168.1.32    ceph-compute02
192.168.1.33    ceph-monitor

Configure all the Ceph nodes with NTP Server so that all nodes have same time and there is no drift in time,

~]# yum install ntp ntpdate ntp-doc -y
~]# ntpdate europe.pool.ntp.org
~]# systemctl start ntpd
~]# systemctl enable ntpd

Create a user with name “cephadm” on all the nodes and we will be using this user for ceph deployment and configuration

~]# useradd cephadm && echo "CephAdm@123#" | passwd --stdin cephadm

Now assign admin rights to user cephadm via sudo, execute the following commands,

~]# echo "cephadm ALL = (root) NOPASSWD:ALL" | sudo tee /etc/sudoers.d/cephadm
~]# chmod 0440 /etc/sudoers.d/cephadm

Disable SELinux on all the nodes using beneath sed command, even ceph official site recommends to disable SELinux ,

~]# sed -i --follow-symlinks 's/SELINUX=enforcing/SELINUX=disabled/g' /etc/sysconfig/selinux

Reboot all the nodes now using beneath command,

~]# reboot

Step:2 Configure Passwordless authentication from Ceph admin to all OSD and monitor nodes

From Ceph-admin node we will use the utility known as “ceph-deploy“, it will login to each ceph node and will install ceph package and will do all the required configurations. While accessing the Ceph node it will not prompt us to enter the credentials of ceph nodes that’s why we required to configure passwordless or keys-based authentication from ceph-admin node to all ceph nodes.

Run the following commands as cephadm user from Ceph-admin node (ceph-controller). Leave the passphrase as empty.

[cephadm@ceph-controller ~]$ ssh-keygen
Generating public/private rsa key pair.
Enter file in which to save the key (/home/cephadm/.ssh/id_rsa):
Created directory '/home/cephadm/.ssh'.
Enter passphrase (empty for no passphrase):
Enter same passphrase again:
Your identification has been saved in /home/cephadm/.ssh/id_rsa.
Your public key has been saved in /home/cephadm/.ssh/id_rsa.pub.
The key fingerprint is:
93:01:16:8a:67:34:2d:04:17:20:94:ad:0a:58:4f:8a cephadm@ceph-controller
The key's randomart image is:
+--[ RSA 2048]----+
|o.=+*o+.         |
| o.=o+..         |
|.oo++.  .        |
|E..o.    o       |
|o       S        |
|.        .       |
|                 |
|                 |
|                 |
+-----------------+
[cephadm@ceph-controller ~]$

Now copy the keys to all the ceph nodes using ssh-copy-id command

[cephadm@ceph-controller ~]$ ssh-copy-id cephadm@ceph-compute01
[cephadm@ceph-controller ~]$ ssh-copy-id cephadm@ceph-compute02
[cephadm@ceph-controller ~]$ ssh-copy-id cephadm@ceph-monitor

It recommended to add the following in the file “~/.ssh/config”

[cephadm@ceph-controller ~]$ vi ~/.ssh/config
Host ceph-compute01
   Hostname ceph-compute01
   User cephadm
Host ceph-compute02
   Hostname ceph-compute02
   User cephadm
Host ceph-monitor
   Hostname ceph-monitor
   User cephadm

Save and exit the file.

cephadm@ceph-controller ~]$ chmod 644 ~/.ssh/config
[cephadm@ceph-controller ~]$

Note: In the above command replace the user name and host name that suits to your setup.

Step:3) Configure firewall rules for OSD and monitor nodes

In case OS firewall is enabled and running on all ceph nodes then we need to configure the below firewall rules else you can skip this step.

On Ceph-admin node, configure the following firewall rules using beneath commands,

[cephadm@ceph-controller ~]$ sudo firewall-cmd --zone=public --add-port=80/tcp --permanent
success
[cephadm@ceph-controller ~]$ sudo firewall-cmd --zone=public --add-port=2003/tcp --permanent
success
[cephadm@ceph-controller ~]$ sudo firewall-cmd --zone=public --add-port=4505-4506/tcp --permanent
success
[cephadm@ceph-controller ~]$ sudo firewall-cmd --reload
success
[cephadm@ceph-controller ~]$

Login the OSD or Ceph Compute Nodes and configure the firewall rules using firewall-cmd command,

[cephadm@ceph-compute01 ~]$ sudo firewall-cmd --zone=public --add-port=6800-7300/tcp --permanent
success
[cephadm@ceph-compute01 ~]$ sudo firewall-cmd --reload
success
[cephadm@ceph-compute01 ~]$
[cephadm@ceph-compute02 ~]$ sudo firewall-cmd --zone=public --add-port=6800-7300/tcp --permanent
success
[cephadm@ceph-compute02 ~]$ sudo firewall-cmd --reload
success
[cephadm@ceph-compute02 ~]$

Login to Ceph Monitor node and execute the firewalld command to configure firewall rules,

[cephadm@ceph-monitor ~]$ sudo firewall-cmd --zone=public --add-port=6789/tcp --permanent
success
[cephadm@ceph-monitor ~]$ sudo firewall-cmd --reload
success
[cephadm@ceph-monitor ~]$

Step:4) Install and Configure Ceph Cluster from Ceph Admin node

Login to your Ceph-admin node as a “cephadm” user and enable the latest version of Ceph yum repository. At time of writing this article, Mimic is latest version of Ceph,

[cephadm@ceph-controller ~]$ sudo rpm -Uvh https://download.ceph.com/rpm-mimic/el7/noarch/ceph-release-1-1.el7.noarch.rpm

Enable EPEL repository as well,

[cephadm@ceph-controller ~]$ sudo yum install -y https://dl.fedoraproject.org/pub/epel/epel-release-latest-7.noarch.rpm

Install the Ceph-deploy utility using the following yum command,

[cephadm@ceph-controller ~]$ sudo yum update -y && sudo yum install ceph-deploy python2-pip  -y

Create a directory with name “ceph_cluster“, this directory will have all Cluster configurations

[cephadm@ceph-controller ~]$ mkdir ceph_cluster
[cephadm@ceph-controller ~]$ cd ceph_cluster/
[cephadm@ceph-controller ceph_cluster]$

Now generate the cluster configuration by executing the ceph-deploy utility on ceph-admin node, we are registering ceph-monitor node as monitor node in ceph cluster. Ceph-deploy utility will also generate “ceph.conf” in the current working directory.

[cephadm@ceph-controller ceph_cluster]$ ceph-deploy new ceph-monitor

Output of above command would be something like below:

ceph-deploy-new-command-output

Update Network address (public network) under the global directive in ceph.conf file,  Here Public network is the network on which Ceph nodes will communicate with each other and external client will also use this network to access the ceph storage,

[cephadm@ceph-controller ceph_cluster]$ vi ceph.conf
[global]
fsid = b1e269f0-03ea-4545-8ffd-4e0f79350900
mon_initial_members = ceph-monitor
mon_host = 192.168.1.33
auth_cluster_required = cephx
auth_service_required = cephx
auth_client_required = cephx
public network = 192.168.1.0/24

Save and exit the file.

Now Install ceph on all the nodes from the ceph-admin node, run the “ceph-deploy install” command

[cephadm@ceph-controller ~]$ ceph-deploy install ceph-controller ceph-compute01 ceph-compute02 ceph-monitor

Above command will install ceph along with other dependencies automatically on all the nodes,  it might take some time depending on the internet speed on ceph nodes.

Output of above “ceph-deploy install” command output would be something like below:

Ceph-Deploy-Install-Command-output

Execute “ceph-deploy mon create-initial” command from ceph-admin node, it will deploy the initial monitors and gather the keys.

[cephadm@ceph-controller ~]$ cd ceph_cluster/
[cephadm@ceph-controller ceph_cluster]$ ceph-deploy mon create-initial

Execute “ceph-deploy admin” command to copy the configuration file from ceph-admin node to all ceph nodes so that one can use ceph cli command without specifying the monitor address.

[cephadm@ceph-controller ceph_cluster]$ ceph-deploy admin ceph-controller ceph-compute01 ceph-compute02 ceph-monitor

Install the Manager daemon from Ceph-admin node on Ceph Compute Nodes (OSD) using the following command

[cephadm@ceph-controller ceph_cluster]$ ceph-deploy mgr create ceph-compute01 ceph-compute02

Step:5) Add OSD disks to Cluster

In my setup I have attached two disks /dev/vdb & /dev/vdc on both the compute nodes, I will use these four disks from compute nodes as OSD disk.

Let’s verify whether ceph-deploy utility can see these disks or not. Run the “ceph-deploy disk list” command from ceph-admin node,

[cephadm@ceph-controller ceph_cluster]$ ceph-deploy disk list ceph-compute01 ceph-compute02

Output of above command:

ceph-deploy-disk-list-command-output

Note: Make sure these disks are not used anywhere and does not contain any data

To clean up and delete data from disks use the following commands,

[cephadm@ceph-controller ceph_cluster]$ ceph-deploy disk zap ceph-compute01 /dev/vdb
[cephadm@ceph-controller ceph_cluster]$ ceph-deploy disk zap ceph-compute01 /dev/vdc
[cephadm@ceph-controller ceph_cluster]$ ceph-deploy disk zap ceph-compute02 /dev/vdb
[cephadm@ceph-controller ceph_cluster]$ ceph-deploy disk zap ceph-compute02 /dev/vdc

Now Mark these disks as OSD using the following commands

[cephadm@ceph-controller ceph_cluster]$ ceph-deploy osd create --data /dev/vdb ceph-compute01
[cephadm@ceph-controller ceph_cluster]$ ceph-deploy osd create --data  /dev/vdc ceph-compute01
[cephadm@ceph-controller ceph_cluster]$ ceph-deploy osd create --data /dev/vdb ceph-compute02
[cephadm@ceph-controller ceph_cluster]$ ceph-deploy osd create --data /dev/vdc ceph-compute02

Step:6) Verify the Ceph Cluster Status

Verify your Ceph cluster status using “ceph health” & “ceph -s“, run these commands from monitor node

[root@ceph-monitor ~]# ceph health
HEALTH_OK
[root@ceph-monitor ~]#
[root@ceph-monitor ~]# ceph -s
  cluster:
    id:     4f41600b-1c5a-4628-a0fc-2d8e7c091aa7
    health: HEALTH_OK

  services:
    mon: 1 daemons, quorum ceph-monitor
    mgr: ceph-compute01(active), standbys: ceph-compute02
    osd: 4 osds: 4 up, 4 in

  data:
    pools:   0 pools, 0 pgs
    objects: 0  objects, 0 B
    usage:   4.0 GiB used, 76 GiB / 80 GiB avail
    pgs:
[root@ceph-monitor ~]#

As we can see in above output that health of ceph cluster is OK and we have 4 OSDs , all of these OSDs are up and active, apart from this we can see that have 80 GB disk space available in our cluster.

This Confirm that we have successfully installed and configured Ceph Cluster on CentOS 7 System, if these steps help you to install ceph in your environment then please do share your feedback and comments.

In the coming article we will discuss how to assign block storage from Ceph cluster to the clients and will see how client can access the block storage.

How to Install and Configure KVM on OpenSUSE Leap 15

$
0
0

KVM is virtualization module that is loaded inside the Linux kernel and then linux kernel start working as a KVM hypervisor. KVM stands for Kernel based Virtual Machine. Before start installing KVM on any Linux System we have to make sure that our system’s processor supports hardware virtualization extensions like Intel VT or AMD-V.

OpenSUSE is one of the most widely used OS (Operating System) at desktop and server level. In this article we will demonstrate how to Install and configure KVM on OpenSUSE Leap 15.

Lab Details : 

  • OS : OpenSUSE Leap 15
  • Hostname : SUSE-KVM
  • IP address (eth0) : 192.168.0.107
  • RAM : 4 GB
  • CPU = 2
  • Disk = 40 GB Free Space ( /var/lib/libvirtd)

Let’s Jump into the Installation and configuration Steps of KVM.

Step:1) Verify Whether Your System’s Processor Support Hardware Virtualization

Open the terminal and execute the below egrep command to verify whether your system’s processor support hardware virtualization or not.

If output of below command is equal to 1 or more than 1 then we can say hardware virtualization is enabled else reboot your system, go to bios settings and enable the hardware virtualization by enabling the Intel VT or AMD virtualization

linuxtechi@SUSE-KVM:~> sudo egrep -c '(vmx|svm)' /proc/cpuinfo
2
linuxtechi@SUSE-KVM:~>

Step:2) Install KVM and its dependencies using Zypper command

Run the below zypper command from the terminal to install KVM and its dependent packages,

linuxtechi@SUSE-KVM:~> sudo zypper -n install patterns-openSUSE-kvm_server patterns-server-kvm_tools

Step:3) Start and enable libvirtd service

linuxtechi@SUSE-KVM:~> sudo systemctl enable libvirtd
Created symlink /etc/systemd/system/multi-user.target.wants/libvirtd.service → /usr/lib/systemd/system/libvirtd.service.
Created symlink /etc/systemd/system/sockets.target.wants/virtlockd.socket → /usr/lib/systemd/system/virtlockd.socket.
Created symlink /etc/systemd/system/sockets.target.wants/virtlogd.socket → /usr/lib/systemd/system/virtlogd.socket.
linuxtechi@SUSE-KVM:~> sudo systemctl restart libvirtd
linuxtechi@SUSE-KVM:~>

Note: If KVM module is not loaded after package installation then run below command to load it,

For Intel based systems

linuxtechi@SUSE-KVM:~> sudo modprobe kvm-intel

For AMD based systems

linuxtechi@SUSE-KVM:~> sudo modprobe kvm-amd

Step:4) Create Bridge and add Interface to it

Let’s create a bride with name Br0 but before make sure bridge-utils package is installed, in case it is not installed then use the below zypper command to install it,

linuxtechi@SUSE-KVM:~> sudo zypper install bridge-utils

Now Start the Yast2 tool,

Yast2 –> Network Settings –> click on Add option

Add-Bridge-SUSE-KVM

In the next window select the Device type as “Bridge” and Configuration Name as “br0

Device-Type-Bridge-Name-OpenSUSE-KVM

click on Next,

In the Next Window, choose Statically assigned IP Option, Specify the IP address for Bridge, netmask and Hostname, i am assigning the same IP address that were assigned to my LAN Card eth0

Br0-IP-address-SUSE-KVM

Now Select the “Bridged Devices” Option and then select LAN Card that you want to associate with br0, in my case it was eth0

Select-Interface-Bride-SUSE-KVM

Click on Next to finish the configuration

Save-Bridge-SUSE-KVM

click OK to write device configuration

To verify whether bridge has been created successfully or not, type the below command from the terminal,

linuxtechi@SUSE-KVM:~> ip a s br0
3: br0: <BROADCAST,MULTICAST,UP,LOWER_UP> mtu 1500 qdisc noqueue state UP group default qlen 1000
link/ether 00:0c:29:63:d5:ea brd ff:ff:ff:ff:ff:ff
inet 192.168.0.107/24 brd 192.168.0.255 scope global br0
valid_lft forever preferred_lft forever
inet6 fe80::20c:29ff:fe63:d5ea/64 scope link
valid_lft forever preferred_lft forever
linuxtechi@SUSE-KVM:~>

Step:5) Creating Virtual Machine from GUI (Virt-Manager)

Virtual machines can be created by two different ways either from virt-manager GUI or via command line,

To create a VM from virt-manager, Access it from Desktop, example is shown below,

Access-Virt-Manager-OpenSUSE-Leap-15

Virt-Manager-OpenSUSE-Leap15

Click on monitor icon to create a new virtual machine

New-VM-OpenSUSE-KVM

As i am using ISO file to install OS, so i am selecting the first option and then click on forward,

Browse-iso-KVM-OpenSUSE

Browse your OS ISO file and then click on forward, in my case i am using Ubuntu 18.04 Server ISO file,

In Next window select RAM and CPU for your VM,

RAM-CPU-VM-OpenSUSE-KVM

click on forward

Specify the disk size of your VM, and then click on forward,

VM-disk-Size-OpenSUSE-KVM

In the next window, Specify the name of your VM and Network and then click on finish

VM-Finish-OpenSUSE-KVM

As we can see below the OS Installation process has bee started, please follow the screen instructions to complete the installation,

Ubuntu18-OS-OpenSUSE-KVM

Once the OS installation is completed , your virt-manager would look like below,

OpenSUSE-KVM-Virt-Manager

This confirms that we have successfully installed and configure KVM on our OpenSUSE Leap 15 system. That’s all from this article, please do share your feedback and comments.

Configure two node Squid (Proxy Server) Clustering using Pacemaker on CentOS 7 / RHEL 7

$
0
0

As we all know that squid is a caching proxy server which supports the protocols like HTTP, HTTPS, FTP and more. In other words, squid is known as a web proxy server which helps the ISPs and other organization to reduce their bandwidth and it also considerably improve the response time as it cache the most frequently content locally. Whenever a new request comes then squid serves it from its cache if it is cached otherwise it will fetch it from remote server and save its content in cache for future requests.

Squid-Clustering-CentOS7

In this article we will demonstrate how to configure two node squid (proxy server) clustering using pacemaker on CentOS 7 or RHEL 7 system.

Following are my lab details that I have used for this article,

  • Squid Server 1  (squid01.linuxtechi.lan) – 192.168.1.21 – Minimal CentOS 7 / RHEL 7
  • Squid Server 2  (squid02.linuxtechi.lan) – 192.168.1.22 – Minimal CentOS 7 / RHEL 7
  • Squid Server VIP – 192.168.1.20
  • Firewall enabled
  • SELinux enabled

Step:1) Add the hostname in /etc/hosts file and apply all the updates

Add the following lines on both squid server’s /etc/hosts file.

192.168.1.21 squid01.linuxtechi.lan squid01
192.168.1.22 squid02.linuxtechi.lan squid02

Install all the updates using beneath yum update command and then reboot the nodes

[root@squid01 ~]# yum update -y && reboot
[root@squid02 ~]# yum update -y && reboot

Step:2) Install Pacemaker and fencing agents packages on both squid servers

Execute the following yum command on both the servers to install pacemaker, pcs and fencing packages,

[root@squid01 ~]# yum install pcs pacemaker fence-agents-all -y
[root@squid02 ~]# yum install pcs pacemaker fence-agents-all -y

Once above packages are installed on both servers then start & enable the pacemaker (pcsd) service using below commands,

[root@squid01 ~]# systemctl start pcsd.service
[root@squid01 ~]# systemctl enable pcsd.service

[root@squid02 ~]# systemctl start pcsd.service
[root@squid02 ~]# systemctl enable pcsd.service

As in my lap setup OS firewall service is running and enabled, so configure the firewall rules for high availability or clustering service, execute the following “firewall-cmd” commands on the squid severs,

[root@squid01 ~]# firewall-cmd --permanent --add-service=high-availability
success
[root@squid01 ~]# firewall-cmd --reload
success
[root@squid01 ~]#
[root@squid02 ~]# firewall-cmd --permanent --add-service=high-availability
success
[root@squid02 ~]# firewall-cmd --reload
success
[root@squid02 ~]#

Step:3) Authorize squid servers and form a squid cluster

To form a cluster both nodes / servers should authorize itself, let’s first set the password of “hacluster” user,

[root@squid01 ~]# echo "password_here" | passwd --stdin hacluster
[root@squid02 ~]# echo "password_here" | passwd --stdin hacluster

Now use the below “pcs cluster auth” command from any of the squid server to authorize both servers using hacluster credentials.

[root@squid01 ~]# pcs cluster auth squid01.linuxtechi.lan squid02.linuxtechi.lan
Username: hacluster
Password:
squid02.linuxtechi.lan: Authorized
squid01.linuxtechi.lan: Authorized
[root@squid01 ~]#

Use below “pcs cluster setup” command from any of the node to form a cluster, in my case I am running it from squid01 and name of my cluster is “squid_cluster

[root@squid01 ~]# pcs cluster setup --start --name squid_cluster squid01.linuxtechi.lan squid02.linuxtechi.lan

Output of above command should be something like below:

Squid-Cluster-CentOS7

Enable the pcs cluster service so that it will be started automatically during the reboot, execute the below command from any of squid server

[root@squid01 ~]# pcs cluster enable --all
squid01.linuxtechi.lan: Cluster Enabled
squid02.linuxtechi.lan: Cluster Enabled
[root@squid01 ~]#

Use the below commands to verify the cluster status,

[root@squid01 ~]# pcs cluster status
[root@squid01 ~]# pcs status

Step:4) Install Squid package on both servers and disable fencing

Execute the following yum command on both the servers to install squid (proxy server) packages,

[root@squid01 ~]# yum install squid -y
[root@squid02 ~]# yum install squid -y

Allow the squid port (3128) in OS firewall using following command

[root@squid01 ~]# firewall-cmd --permanent --add-service=squid
success
[root@squid01 ~]# firewall-cmd --reload
success
[root@squid01 ~]#
[root@squid02 ~]# firewall-cmd --permanent --add-service=squid
success
[root@squid02 ~]# firewall-cmd --reload
success
[root@squid02 ~]#

In my lab I don’t have any fencing agent or device, so I am disabling it using the beneath commands,

[root@squid01 ~]# pcs property set stonith-enabled=false
[root@squid01 ~]# pcs property set no-quorum-policy=ignore
[root@squid01 ~]#

Step:5) Configure Squid Cluster resources and cluster group

In my lab setup I have two shared disks of size 1GB and 12 GB, these disks are assigned to both servers.

In cluster we will mount the /etc/squid (i.e squid configuration files) file system on 1 GB disk and “/var/spool/squid” ( i.e squid cache directory) will be mounted on 12 GB disk

  • /dev/sdb (1 GB Disk) – /etc/squid
  • /dev/sdc (12 GB disk) – /var/spool/squid

As these disks are visible on both squid servers, so create a partition on /dev/sdb & /dev/sdc using fdisk command from either of squid server and then format them with xfs file system using mkfs.xfs command

Currently all the squid configuration files are on local folder /etc/squid, Copy the data from local filesystem /etc/squid to shared disk (/dev/sdb1)

[root@squid01 ~]# mount /dev/sdb1 /mnt/
[root@squid01 ~]# cp -av /etc/squid/* /mnt/
[root@squid01 ~]# umount /mnt/

Now create two filesystem resource , one for /etc/squid file system and one for /var/spool/squid

Execute the following “pcs resource create” command from any of the squid server to create file system resource, in my case taking the file system resource name as “squidfs1” & “squidfs2” and group name as “squidgrp

[root@squid01 ~]# pcs resource create squidfs1 Filesystem device=/dev/sdb1 directory=/etc/squid fstype=xfs --group squidgrp
[root@squid01 ~]# pcs resource create squidfs2 Filesystem device=/dev/sdc1 directory=/var/spool/squid fstype=xfs --group squidgrp 
[root@squid01 ~]#

Define the squid (systemd service) resource using pcs resource command, execute the beneath command from any of  the squid server

[root@squid01 ~]# pcs resource create proxy systemd:squid op monitor interval=10s --group squidgrp
[root@squid01 ~]#

Define squid vip for your cluster, in my case i will be using “192.168.1.20” as squid vip , this IP will float between these servers, end users or squid clients will use this IP as squid proxy server IP while configuring their proxy settings and also use the default squid port 3128.

[root@squid01 ~]# pcs resource create squid_vip ocf:heartbeat:IPaddr2 ip=192.168.1.20 cidr_netmask=24 op monitor interval=30s --group squidgrp
[root@squid01 ~]#

Now verify the whether all the cluster resources are started or not.  Run “pcs status” command from any of squid server

[root@squid01 ~]# pcs status
Cluster name: squid_cluster
Stack: corosync
Current DC: squid01.linuxtechi.lan (version 1.1.19-8.el7_6.4-c3c624ea3d) - partition with quorum
Last updated: Wed Mar 27 06:59:59 2019
Last change: Wed Mar 27 06:59:02 2019 by root via cibadmin on squid01.linuxtechi.lan

2 nodes configured
4 resources configured

Online: [ squid01.linuxtechi.lan squid02.linuxtechi.lan ]
Full list of resources:
 Resource Group: squidgrp
     squidfs1   (ocf::heartbeat:Filesystem):    Started squid01.linuxtechi.lan
     squidfs2   (ocf::heartbeat:Filesystem):    Started squid01.linuxtechi.lan
     proxy      (systemd:squid):        Started squid01.linuxtechi.lan
     squid_vip  (ocf::heartbeat:IPaddr2):       Started squid01.linuxtechi.lan

Daemon Status:
  corosync: active/enabled
  pacemaker: active/enabled
  pcsd: active/enabled
[root@squid01 ~]#

As we can see above, all the resources are started on squid01 server. Let’s verify the Squid Service status and squid vip

[root@squid01 ~]# systemctl status squid
[root@squid01 ~]# ip a s

Output of above two commands should be something like below:

Squid-Service-Status-CentOS7

That’s all from this article, now you can configure the ACLs that suits to your environment in /etc/squid.conf file. Please do share your feedback and comments.

How to Install and Configure OTRS (Ticketing Tool) on CentOS 7 / RHEL 7

$
0
0

OTRS is a free and open source ticketing tool available for Linux like operating systems. OTRS stands for “Open Source Trouble Ticket System“. In opensource world it is one of the most popular trouble ticketing tool used by help desk, call centers and IT service management team in various organizations.

Install-OTRS-CentOS7-RHEL7

In this article we will demonstrate how to install and configure OTRS 6 (Community Edition) on a CentOS 7 & RHEL 7 System. To Install OTRS community edition on a Linux system we need one database server (MariaDB, MySQL & PostgreSQL), Web Server (Apache & Ngnix) and Perl modules.

Following are the recommended hardware and software requirements for OTRS 6

  • 8 GB RAM
  • 3 GHZ Xenon
  • 256 GB Disk space
  • Perl 5.16 or higher
  • Web Server (Apache 2 or NGINX)
  • Database (MariaDB, MySQL & PostgreSQL 9.2 or higher)

Details of my lab setup for OTRS 6

  • Minimal CentOS 7 Or RHEL 7 System
  • Hostname: otrs.linuxtechi.lan
  • IP Address: 192.168.1.30
  • RAM: 4 GB
  • vCPU: 2
  • Disk Space: 40 GB

Let’s jump into the OTRS 6 installations steps,

Step:1) Apply all system updates and reboot the system

Login to your CentOS 7 or RHEL 7 system and execute the beneath yum update command to apply all the system updates and then reboot it,

[root@otrs ~]# yum update && reboot

Note: Put SELinux in permissive mode, even OTRS official web site suggests to disable SELinux, execute the below command.

[root@otrs ~]# setenforce 0
[root@otrs ~]# sed -i --follow-symlinks 's/SELINUX=enforcing/SELINUX=permissive/g' /etc/sysconfig/selinux

Step:2) Install Web Server (Apache) and Database Server (MariaDB)

Install Apache Web Server and MariaDB database server using the beneath yum command,

[root@otrs ~]# yum install httpd httpd-devel gcc mariadb-server -y

Start and enable the Apache Web service using below commands,

[root@otrs ~]# systemctl start httpd
[root@otrs ~]# systemctl enable httpd
Created symlink from /etc/systemd/system/multi-user.target.wants/httpd.service to /usr/lib/systemd/system/httpd.service.
[root@otrs ~]#

Update the following parameters under the [mysqld] directive in /etc/my.cnf file for OTRS

[root@otrs ~]# vi /etc/my.cnf
[mysqld]
datadir=/var/lib/mysql
socket=/var/lib/mysql/mysql.sock
max_allowed_packet=64M
query_cache_size=32M
innodb_log_file_size=256M
character-set-server=utf8
collation-server=utf8_unicode_ci

Save & exit the file

Start and enable the database (mysql) service using the beneath systemctl commands,

[root@otrs ~]# systemctl start mariadb
[root@otrs ~]# systemctl enable mariadb
Created symlink from /etc/systemd/system/multi-user.target.wants/mariadb.service to /usr/lib/systemd/system/mariadb.service.
[root@otrs ~]#

Configure the root password of mariadb database, remove the test database, remove anonymous users and disable root login remotely.

Run “mysql_secure_installation” command to accomplish above said tasks

[root@otrs ~]# mysql_secure_installation

Output of above command should be something like below,

mysql-secure-installation-centos7-part1

mysql-secure-installation-centos7-part2

Step:3) Install Community Edition OTRS 6 using yum command

At time of writing of this article community edition of OTRS 6 is available, use the below yum command to install it from command line.

[root@otrs ~]# yum install https://ftp.otrs.org/pub/otrs/RPMS/rhel/7/otrs-6.0.17-01.noarch.rpm -y

Above command will also install the dependencies of OTRS 6 automatically,

Once the OTRS 6 package is installed successfully then restart apache web service,

[root@otrs ~]# systemctl restart httpd
[root@otrs ~]#

Step:4) Allow http & https ports in OS firewall

In case OS firewall is running and enabled on your system then execute the following firewall-cmd command to allow http (80) and https (443) port, else you can skip this step.

[root@otrs ~]# firewall-cmd --permanent --add-service=http
success
[root@otrs ~]# firewall-cmd --permanent --add-service=https
success
[root@otrs ~]# firewall-cmd --reload
success
[root@otrs ~]#

Step:5) Verify and install required perl modules for OTRS

OTRS to work properly, perl modules are required, to verify whether all required perl modules are installed or not run the below command

[root@otrs ~]# /opt/otrs/bin/otrs.CheckModules.pl

Output of above command would be something like below,

Perl-Modules-Check-OTRS-CentOS7

As we can see above there are number of perl modules which are not installed. So to proceed with installation first install the missing perl modules.

Some of the perl modules are not available in the default yum centos 7 / RHEL 7 repositories, so enable the epel repository using following yum command,

[root@otrs ~]# yum install epel-release -y

Now install the missing perl modules using the following yum command,

[root@otrs ~]# yum install "perl(Crypt::Eksblowfish::Bcrypt)" "perl(DBD::Pg)" "perl(Encode::HanExtra)" "perl(JSON::XS)" "perl(Mail::IMAPClient)" "perl(Authen::NTLM)" "perl(ModPerl::Util)" "perl(Text::CSV_XS)" "perl(YAML::XS)" -y

Re-run the command “/opt/otrs/bin/otrs.CheckModules.pl” to verify whether all the required perl modules are installed successfully or not.

[root@otrs ~]# /opt/otrs/bin/otrs.CheckModules.pl

OTRS-Perl-Modules-CentOS7

Step:5) Access OTRS 6 Web Installer GUI

Type the following URL in your web browser

http://<OTRS-Server-IP-Adrress>/otrs/installer.pl

In my case URL is  “http://192.168.1.30/otrs/installer.pl”

Install-OTRS-License-CentOS7

Click on Next …

In the Next Window, Accept the License

Install-OTRS-Accept-License

In the Next Step select the database you want to use for OTRS, so in my case I am selecting as “MySQL” and select option to create a new database for OTRS and then click on Next…

Database-Selection-OTRS-Installation-CentOS7

In the next window specify the root password of mariadb database server, host where mariadb is running and rest of the things installer will automatically pick like OTRS database name, user name and its password.

OTRS-Database MySQL-CentOS7

Click on Next to proceed further,

OTRS-Database-Successfully-CentOS7

As we can see above, Installer has successfully setup Database for OTRS, Click on Next…

Install-OTRS-System-Settings-CentOS7

Specify the FQDN of your OTRS server, admin email address, Organization and Choose “No” against CheckMXRecord option in case your domain don’t have MX record .

In the next window SKIP mail configuration, In case you have already configured MTA or SMTP relay server then specify the details else skip

OTRS-Configure-Mail-CentOS7

In Next window you will get message that OTRS has been installed successfully, OTRS Start Page URL, user name and its password.

OTRS-Installation-Finished-Message-CentOS7

Step:6) Access Your OTRS Startup page

Now it’s time to access your otrs startup page, type the following URL in your web browser. Use the user name as “root@localhost” and password which is displayed in above step.

http://192.168.1.30/otrs/index.pl

Replace the IP address that suits to your environment.

OTRS-Login-Page-CentOS7

OTRS-Dashboard-CentOS7

As we can see on the dashboard OTRS daemon is not running, so let’s start it using otrs user,

[root@otrs ~]# su - otrs
[otrs@otrs ~]$ /opt/otrs/bin/otrs.Daemon.pl start
Manage the OTRS daemon process.
Daemon started
[otrs@otrs ~]$ /opt/otrs/bin/Cron.sh start
(using /opt/otrs) done
[otrs@otrs ~]$

Now refresh the page, “OTRS daemon not running” message should go away.

OTRS-Clean-Dashboard-CentOS7

This confirm that Community Edition OTRS 6 has been installed successfully, that’s all from this article, please do share your feedback and comments in the comments sections below.


Quick Guide on Docker Utilities, Daemon and its other capabilities

$
0
0
Introduction

Docker is playing very critical role as both a packaging format for the applications and a unifying interface and methodology that enables the application team/s to own the Docker-formatted container images (Note: It is assumed that including all dependencies). This has made Docker as one of the leading front runners in microservices and microservices based adaption and usage.

Docker-Utilities-Daemon

Many of the Docker and Docker based utilities helps us to bring greater efficiencies of scalability and performance by shrinking application footprints through Dockerized containers. In many cases system-level dependencies are reduced to bare minimum, which helps in bringing down memory usage in terms of MB’s (Mega bytes).

All these aspects helped in making Docker as one of the leading container based utility. Docker has many command-line utilities and capabilities. Docker Daemon can provide many of these additional facilities and which makes Docker configuration easier.

Read Also :20 useful Docker Command examples in Linux

Hope the reader/user of this article knows how to spin-off docker-container on any given Linux environment. Assuming this, some of the following facilities are described,

Some of these facilities can be used for the following functions,

  • Check Docker server information
  • Download docker images and updates
  • Inspect containers
  • View and monitor logs
  • Monitor various statistics and details

1) How to check present docker version

Knowing the docker version is one of the very important aspects as depending on this, many of the version based decisions are taken.

shashi@linuxtechi:~$ sudo docker version
Client:
 Version:           18.09.5
 API version:       1.39
 Go version:        go1.10.8
 Git commit:        e8ff056
 Built:             Thu Apr 11 04:43:57 2019
 OS/Arch:           linux/amd64
 Experimental:      false

Server: Docker Engine - Community
 Engine:
  Version:          18.09.5
  API version:      1.39 (minimum version 1.12)
  Go version:       go1.10.8
  Git commit:       e8ff056
  Built:            Thu Apr 11 04:10:53 2019
  OS/Arch:          linux/amd64
  Experimental:     false
shashi@linuxtechi:~$

This above output provides both server and client API versions as same and OS and Architecture version also should be same. If there is any mismatch in client and server based versions, client-server communication will fail. One has to make sure what the supporting versions are and take decisions accordingly.

2) Capturing and analyzing server information

Using docker info we can also find the following information. Some of the useful information we can gather are something like, which server is running as backend, which kernel version it is, which OS and Docker root directory etc

shashi@linuxtechi:~$ sudo docker info
Containers: 2
 Running: 1
 Paused: 0
 Stopped: 1
Images: 4
Server Version: 18.09.5
Storage Driver: overlay2
 Backing Filesystem: extfs
 Supports d_type: true
 Native Overlay Diff: true
Logging Driver: json-file
Cgroup Driver: cgroupfs
Plugins:
 Volume: local
 Network: bridge host macvlan null overlay
 Log: awslogs fluentd gcplogs gelf journald json-file local logentries splunk syslog
Swarm: inactive
Runtimes: runc
Default Runtime: runc
Init Binary: docker-init
containerd version: bb71b10fd8f58240ca47fbb579b9d1028eea7c84
runc version: 2b18fe1d885ee5083ef9f0838fee39b62d653e30
init version: fec3683
Security Options:
 apparmor
 seccomp
  Profile: default
Kernel Version: 4.15.0-20-generic
Operating System: Ubuntu 18.04 LTS
OSType: linux
Architecture: x86_64
CPUs: 1
Total Memory: 1.947GiB
Name: linuxtechi
ID: VRUY:AWXX:7JWE:YWU7:X4QW:TNKE:6H26:PNRR:QFGI:XYRQ:QUXF:MTXC
Docker Root Dir: /var/lib/docker
Debug Mode (client): false
Debug Mode (server): false
Registry: https://index.docker.io/v1/
Labels:
Experimental: false
Insecure Registries:
 127.0.0.0/8
Live Restore Enabled: false
Product License: Community Engine
WARNING: No swap limit support
shashi@linuxtechi:~$

All the above information is based on how the Docker Daemon is set-up, underlying OS version and file system type. All these can be captured using the following set-of the commands,

Execute the below command to get OS Name, its version and Code name

shashi@linuxtechi:~$ cat /etc/lsb-release
DISTRIB_ID=Ubuntu
DISTRIB_RELEASE=18.04
DISTRIB_CODENAME=bionic
DISTRIB_DESCRIPTION="Ubuntu 18.04 LTS"
shashi@linuxtechi:~$

or

shashi@linuxtechi:~$ cat /etc/*-release
DISTRIB_ID=Ubuntu
DISTRIB_RELEASE=18.04
DISTRIB_CODENAME=bionic
DISTRIB_DESCRIPTION="Ubuntu 18.04 LTS"
NAME="Ubuntu"
VERSION="18.04 LTS (Bionic Beaver)"
ID=ubuntu
ID_LIKE=debian
PRETTY_NAME="Ubuntu 18.04 LTS"
VERSION_ID="18.04"
HOME_URL="https://www.ubuntu.com/"
SUPPORT_URL="https://help.ubuntu.com/"
BUG_REPORT_URL="https://bugs.launchpad.net/ubuntu/"
PRIVACY_POLICY_URL="https://www.ubuntu.com/legal/terms-and-policies/privacy-policy"
VERSION_CODENAME=bionic
UBUNTU_CODENAME=bionic
shashi@linuxtechi:~$

Execute the beneath command to get the file system details :

shashi@linuxtechi:~$ mount | grep "^/dev"
/dev/sda1 on / type ext4 (rw,relatime,errors=remount-ro,data=ordered)
shashi@linuxtechi:~$

3) Docker daemon

The docker daemon plays a very crucial role in docker environment as whole.

Without a proper daemon, the complete docker system will be useless. One can verify the daemon status using the following command,

Note:- Assuming proper docker installation is done

shashi@linuxtechi:~$ sudo service docker status

If the docker service is running, then output of above command should be something like below:

docker-service-status-output-ubuntu18

In case docker service is not running then use below command to start it

shashi@linuxtechi:~$ sudo systemctl start docker
or
shashi@linuxtechi:~$ sudo service docker start
shashi@linuxtechi:~$

Use below “docker ps” command to list the running containers

shashi@linuxtechi:~$ sudo docker ps
CONTAINER ID        IMAGE               COMMAND             CREATED             STATUS              PORTS               NAMES
shashi@linuxtechi:~$

To list all running and stopped containers use “docker ps -a

shashi@linuxtechi:~$ sudo docker ps -a
CONTAINER ID        IMAGE               COMMAND             CREATED             STATUS                      PORTS               NAMES
497e6733d760        ubuntu              "bash"              19 minutes ago      Exited (0) 2 minutes ago                        goofy_morse
0862fe109f96        hello-world         "/hello"            19 minutes ago      Exited (0) 19 minutes ago                       vibrant_shannon
shashi@linuxtechi:~$

Docker default root directory  is “/var/lib/docker”

shashi@linuxtechi:~$ sudo ls -l /var/lib/docker
total 48
drwx------  2 root root 4096 Apr 14 07:00 builder
drwx------  4 root root 4096 Apr 14 07:00 buildkit
drwx------  4 root root 4096 Apr 14 07:09 containers
drwx------  3 root root 4096 Apr 14 07:00 image
drwxr-x---  3 root root 4096 Apr 14 07:00 network
drwx------ 16 root root 4096 Apr 14 07:27 overlay2
drwx------  4 root root 4096 Apr 14 07:00 plugins
drwx------  2 root root 4096 Apr 14 07:27 runtimes
drwx------  2 root root 4096 Apr 14 07:00 swarm
drwx------  2 root root 4096 Apr 14 07:27 tmp
drwx------  2 root root 4096 Apr 14 07:00 trust
drwx------  2 root root 4096 Apr 14 07:00 volumes
shashi@linuxtechi:~$

The docker daemon if not started can be invoked using the following command,

shashi@linuxtechi:~$ sudo dockerd

Output of above dockerd command will be something like below:

dockerd-command-output-ubuntu18

Read Also : How to install Docker on CentOS 7

4) Downloading docker container image and inspecting the container

shashi@linuxtechi:~$ sudo docker pull ubuntu:latest
Using default tag: latest
latest: Pulling from library/ubuntu
898c46f3b1a1: Pull complete
63366dfa0a50: Pull complete
041d4cd74a92: Pull complete
6e1bee0f8701: Pull complete
Digest: sha256:017eef0b616011647b269b5c65826e2e2ebddbe5d1f8c1e56b3599fb14fabec8
Status: Downloaded newer image for ubuntu:latest
shashi@linuxtechi:~$
latest: Pulling from library/ubuntu898c46f3b1a1: Pull complete
63366dfa0a50: Pull complete
041d4cd74a92: Pull complete6e1bee0f8701: Pull complete
Digest: sha256:017eef0b616011647b269b5c65826e2e2ebddbe5d1f8c1e56b3599fb14fabec8Status: Downloaded newer image for ubuntu:latest

Launching a container, example is shown below

shashi@linuxtechi:~$ sudo docker run -d -t ubuntu /bin/bash
58c023f0f5689ff08b858221ca10c985936a8c9dd91d08e84213009facb64724
shashi@linuxtechi:~$
shashi@linuxtechi:~$ sudo docker ps
CONTAINER ID        IMAGE               COMMAND             CREATED             STATUS              PORTS               NAMES
58c023f0f568        ubuntu              "/bin/bash"         27 seconds ago      Up 26 seconds                           boring_dijkstra
shashi@linuxtechi:~$

Let’s inspect this container using the following command,

shashi@linuxtechi:~$ sudo docker inspect 58c023f0f568
[
    {
        "Id": "58c023f0f5689ff08b858221ca10c985936a8c9dd91d08e84213009facb64724",
        "Created": "2019-04-14T06:55:26.289022884Z",
        "Path": "/bin/bash",
        "Args": [],
        "State": {
            "Status": "running",
            "Running": true,
            "Paused": false,
            "Restarting": false,
            "OOMKilled": false,
            "Dead": false,
            "Pid": 15538,
            "ExitCode": 0,
            "Error": "",
            "StartedAt": "2019-04-14T06:55:27.142274111Z",
            "FinishedAt": "0001-01-01T00:00:00Z"
        },
        "Image": "sha256:94e814e2efa8845d95b2112d54497fbad173e45121ce9255b93401392f538499",
        "ResolvConfPath": "/var/lib/docker/containers/58c023f0f5689ff08b858221ca10c985936a8c9dd91d08e84213009facb64724/resolv.conf",
………………………………………………

Note:- The complete output of this command is not shown here, because it’s output is too large

5) Going inside the running container image

As one is aware of Docker used originally everything based on LXC backend, lxc-attach command of linux was used for quite some time. But once docker was built as a standalone package and started using “libcontainer” as the default backend, the “docker exec” command usage became popular

Below set of commands explain on how to login into container using command line,

:~$ sudo docker  exec -t <Container_id>  <Commands>

shashi@linuxtechi:~$ sudo docker  exec -t 58c023f0f568 ls -a
.   .dockerenv  boot  etc   lib    media  opt   root  sbin  sys  usr
..  bin         dev   home  lib64  mnt    proc  run   srv   tmp  var
shashi@linuxtechi:~$ sudo docker  exec -t 58c023f0f568 ps -ef
UID        PID  PPID  C STIME TTY          TIME CMD
root         1     0  0 06:55 pts/0    00:00:00 /bin/bash
root        20     0  0 07:17 pts/1    00:00:00 ps -ef
shashi@linuxtechi:~$

The alternate way to run commands inside the container is, first login to container using “docker attach” and then execute commands

:~$ sudo docker attach <Container_id>

shashi@linuxtechi:~$ sudo docker attach 58c023f0f568
root@58c023f0f568:/#

There are some situations where you want to launch a container, attaching a volume to it and when we exit from container it should deleted automatically, example is shown below

shashi@linuxtechi:~$ sudo docker run -it --rm -v /usr/local/bin:/target jpetazzo/nsenter bash
root@73c72922f87e:/src# df -h /target/
Filesystem      Size  Used Avail Use% Mounted on
/dev/sda1        18G  5.6G   12G  34% /target
root@73c72922f87e:/src# exit
exit
shashi@linuxtechi:~$

Now verify whether docker is removed or not automatically when we exit from the container, run “docker ps”

shashi@linuxtechi:~$ sudo docker ps
CONTAINER ID        IMAGE               COMMAND             CREATED             STATUS              PORTS               NAMES
58c023f0f568        ubuntu              "/bin/bash"         About an hour ago   Up About an hour                        boring_dijkstra
shashi@linuxtechi:~$

6) Monitoring Docker

Use “docker stats” command to display resource utilization of all the containers,

shashi@linuxtechi:~$ sudo docker stats
CONTAINER ID        NAME                CPU %               MEM USAGE / LIMIT     MEM %               NET I/O             BLOCK I/O           PIDS
58c023f0f568        boring_dijkstra     0.00%               1.059MiB / 1.947GiB   0.05%               4.75kB / 0B         4.74MB / 0B         1
CONTAINER ID        NAME                CPU %               MEM USAGE / LIMIT     MEM %               NET I/O             BLOCK I/O           PIDS
58c023f0f568        boring_dijkstra     0.00%               1.059MiB / 1.947GiB   0.05%               4.75kB / 0B         4.74MB / 0B         1
shashi@linuxtechi:~$

7) Docker Events

Many a times capturing docker events will be crucial as this will provide information on various docker operations and events taking place. Below is the snapshot of the same.

shashi@linuxtechi:~$ sudo docker events
2019-04-14T09:29:07.636990738+01:00 image pull wordpress:latest (name=wordpress)
2019-04-14T09:29:46.936676431+01:00 volume create 36187e0a44d277439fea0df2446fc44987fa814c52744091929e5c81bd8134e5 (driver=local)
2019-04-14T09:29:46.998798935+01:00 container create b97f6a565c518eb1464cf81e6e09db1acfd84a0fdcbaea94255f1f182d79c058 (image=wordpress, name=friendly_heisenberg)
2019-04-14T09:29:47.000202026+01:00 container attach b97f6a565c518eb1464cf81e6e09db1acfd84a0fdcbaea94255f1f182d79c058 (image=wordpress, name=friendly_heisenberg)
2019-04-14T09:29:47.209257002+01:00 network connect 18dd93c3c6fc9ce51a98f7d2359b319db251efcae6b991157965ef727a580702 (container=b97f6a565c518eb1464cf81e6e09db1acfd84a0fdcbaea94255f1f182d79c058, name=bridge, type=bridge)
2019-04-14T09:29:47.239846902+01:00 volume mount 36187e0a44d277439fea0df2446fc44987fa814c52744091929e5c81bd8134e5 (container=b97f6a565c518eb1464cf81e6e09db1acfd84a0fdcbaea94255f1f182d79c058, destination=/var/www/html, driver=local, propagation=, read/write=true)
2019-04-14T09:29:47.942997316+01:00 container start b97f6a565c518eb1464cf81e6e09db1acfd84a0fdcbaea94255f1f182d79c058 (image=wordpress, name=friendly_heisenberg)
2019-04-14T09:29:47.944521098+01:00 container resize b97f6a565c518eb1464cf81e6e09db1acfd84a0fdcbaea94255f1f182d79c058 (height=39, image=wordpress, name=friendly_heisenberg, width=130)
2019-04-14T09:29:59.829378089+01:00 container die b97f6a565c518eb1464cf81e6e09db1acfd84a0fdcbaea94255f1f182d79c058 (exitCode=0, image=wordpress, name=friendly_heisenberg)
2019-04-14T09:30:00.147435896+01:00 network disconnect 18dd93c3c6fc9ce51a98f7d2359b319db251efcae6b991157965ef727a580702 (container=b97f6a565c518eb1464cf81e6e09db1acfd84a0fdcbaea94255f1f182d79c058, name=bridge, type=bridge)
2019-04-14T09:30:00.845336887+01:00 volume unmount 36187e0a44d277439fea0df2446fc44987fa814c52744091929e5c81bd8134e5 (container=b97f6a565c518eb1464cf81e6e09db1acfd84a0fdcbaea94255f1f182d79c058, driver=local)
………………
Conclusion

The combination of all these commands and utilities are very important in making docker and container a successful microservices based environment. As many of the microservices architectures need these kinds of utilities to debug, understand and learn more about them for every day usage, I hope this article will play role in helping such cases.

Read Also : How to install and use docker-compose to deploy containers in CentOS 7

Monitor and Manage Docker Containers with Portainer.io (GUI tool) – Part-1

$
0
0

As Docker usage and adoption is growing faster and faster, monitoring Docker container images is becoming more challenging. As multiple Docker container images are getting created day-by-day, monitoring them is very important. There are already some in built tools and technologies, but configuring them is little complex. As micro-services based architecture is becoming the de-facto standard in coming days, learning such tool adds one more arsenal to your tool-set.

Based on the above scenarios, there was in need of one light weight and robust tool requirement was growing. So Portainer.io addressed this. “Portainer.io“,(Latest version is 1.20.2) the tool is very light weight(with 2-3 commands only one can configure it) and has become popular among Docker users.

This tool has advantages over other tools; some of these are as below,

  • Light weight (requires only 2-3 commands to be required to run to install this tool) {Also installation image is only around 26-30MB of size)
  • Robust and easy to use
  • Can be used for Docker monitor and Build
  • This tool provides us a detailed overview of your Docker environments
  • This tool allows us to manage your containers, images, networks and volumes.
  • Portainer is simple to deploy – this requires just one Docker command (can be run from anywhere.)
  • Complete Docker-container environment can be monitored easily

Portainer is also equipped with,

  • Community support
  • Enterprise support
  • Has professional services available(along with partner OEM services)

Functionality and features of Portainer tool are,

  1. It comes-up with nice Dashboard, easy to use and monitor.
  2. Many in-built templates for ease of operation and creation
  3. Support of services (OEM, Enterprise level)
  4. Monitoring of Containers, Images, Networks, Volume and configuration at almost real-time.
  5. Also includes Docker-Swarm monitoring
  6. User management with many fancy capabilities

Read Also : How to Install Docker CE on Ubuntu 16.04 / 18.04 LTS System

How to install and configure Portainer.io on Ubuntu Linux / RHEL / CentOS 

Note: This installation is done on Ubuntu 18.04 but the installation on RHEL & CentOS would be same. We are assuming Docker CE is already installed on your system.

shashi@linuxtechi:~$ lsb_release -a
No LSB modules are available.
Distributor ID: Ubuntu
Description:    Ubuntu 18.04 LTS
Release:        18.04
Codename:       bionic
shashi@linuxtechi:~$

Create the Volume for portainer

shashi@linuxtechi:~$ sudo docker volume create portainer_data
portainer_data
shashi@linuxtechi:~$

Launch and start Portainer Container using the beneath docker command,

shashi@linuxtechi:~$ sudo docker run -d -p 9000:9000 -v /var/run/docker.sock:/var/run/docker.sock -v portainer_data:/data portainer/portainer
Unable to find image 'portainer/portainer:latest' locally
latest: Pulling from portainer/portainer
d1e017099d17: Pull complete
0b1e707a06d2: Pull complete
Digest: sha256:d6cc2c20c0af38d8d557ab994c419c799a10fe825e4aa57fea2e2e507a13747d
Status: Downloaded newer image for portainer/portainer:latest
35286de9f2e21d197309575bb52b5599fec24d4f373cc27210d98abc60244107
shashi@linuxtechi:~$

Once the complete installation is done, use the ip of host or Docker using port 9000 of the Docker engine where portainer is running using your browser.

Note: If OS firewall is enabled on your Docker host then make sure 9000 port is allowed else its GUI will not come up.

In my case, IP address of my Docker Host / Engine is “192.168.1.16” so URL will be,

http://192.168.1.16:9000

Portainer-Login-User-Name-Password

Please make sure that you enter 8-character passwords. Let the admin be the user as it is and then click “Create user”.

Now the following screen appears, in this select “Local” rectangle box.

Connect-Portainer-Local-Docker

Click on “Connect”

Nice GUI with admin as user home screen appears as below,

Portainer-io-Docker-Monitor-Dashboard

Now Portainer is ready to launch and manage your Docker containers and it can also be used for containers monitoring.

Bring-up container image on Portainer tool

Portainer-Endpoints

Now check the present status, there are two container images are already running, if you create one more that appears instantly.

From your command line kick-start one or two containers as below,

shashi@linuxtechi:~$ sudo docker run --name test -it debian
Unable to find image 'debian:latest' locally
latest: Pulling from library/debian
e79bb959ec00: Pull complete
Digest: sha256:724b0fbbda7fda6372ffed586670573c59e07a48c86d606bab05db118abe0ef5
Status: Downloaded newer image for debian:latest
root@d45902e717c0:/#

Now click Refresh button (Are you sure message appears, click “continue” on this) in Portainer GUI, you will now see 3 container images as highlighted below,

Portainer-io-new-container-image

Click on the “containers” (in which it is red circled above), next window appears with “Dashboard Endpoint summary

Portainer-io-Docker-Container-Dash

In this page, click on “Containers” as highlighted in red color. Now you are ready to monitor your container image.

Simple Docker container image monitoring

From the above step, it appears that a fancy and nice looking “Container List” page appears as below,

Portainer-Container-List

All the container images can be controlled from here (stop, start, etc)

1) Now from this page, stop the earlier started {“test” container (this was the debian image that we started earlier)}

To do this select the check box in front of this image and click stop button from above,

Stop-Container-Portainer-io-dashboard

From the command line option, you will see that this image has been stopped or exited now,

shashi@linuxtechi:~$ sudo docker container ls -a
CONTAINER ID        IMAGE                 COMMAND             CREATED             STATUS                       PORTS                    NAMES
d45902e717c0        debian                "bash"              21 minutes ago      Exited (0) 49 seconds ago                             test
08b96eddbae9        centos:7              "/bin/bash"         About an hour ago   Exited (137) 9 minutes ago                            mycontainer2
35286de9f2e2        portainer/portainer   "/portainer"        2 hours ago         Up About an hour             0.0.0.0:9000->9000/tcp   compassionate_benz
shashi@linuxtechi:~$

2) Now start the stopped containers (test & mycontainer2) from Portainer GUI,

Select the check box in front of stopped containers, and the click on Start

Start-Containers-Portainer-GUI

You will get a quick window saying, “Container successfully started” and with running state

Conatiner-Started-successfully-Portainer-GUI

Various other options and features are explored as below step-by-step

1) Click on “Images” which is highlighted, you will get the below window,

Docker-Container-Images-Portainer-GUI

This is the list of container images that are available but some may not running. These images can be imported, exported or uploaded to various locations, below screen shot shows the same,

Upload-Docker-Container-Image-Portainer-GUI

2) Click on “volumes” which is highlighted, you will get the below window,

Volume-list-Portainer-io-gui

3) Volumes can be added easily with following option, click on add volume button, below window appears,

Provide the name as “myvol” in the name box and click on “create the volume” button.

Volume-Creation-Portainer-io-gui

The newly created volume appears as below, (with unused state)

Volume-unused-Portainer-io-gui

Conclusion:

As from the above installation steps, configuration and playing around with various options you can see how easy and fancy looking is Portainer.io tool is. This provides multiple features and options to explore on building, monitoring docker container. As explained this is very light weight tool, so doesn’t add any overload to host system. Next set-of options will be explored in part-2 of this series.

Read Also: Monitor and Manage Docker Containers with Portainer.io (GUI tool) – Part-2

How to Setup Local Yum/DNF Repository on RHEL 8 Server Using DVD or ISO File

$
0
0

Recently Red Hat has released its most awaited operating system “RHEL 8“, in case you have installed RHEL 8 Server on your system and wondering how to setup local yum or dnf repository using installation DVD or ISO file then refer below steps and procedure.

Setup-Local-Repo-RHEL8

In RHEL 8, we have two package repositories:

  • BaseOS
  • Application Stream

BaseOS repository have all underlying OS packages where as Application Stream repository have all application related packages, developer tools and databases etc. Using Application stream repository, we can have multiple of versions of same application and Database.

Step:1) Mount RHEL 8 ISO file / Installation DVD

To mount RHEL 8 ISO file inside your RHEL 8 server use the beneath mount command,

[root@linuxtechi-rhel8 ~]# mount -o loop rhel-8.0-x86_64-dvd.iso /opt/

Note: I am assuming you have already copied RHEL 8 ISO file inside your system,

In case you have RHEL 8 installation DVD, then use below mount command to mount it,

[root@linuxtechi-rhel8 ~]# mount /dev/sr0  /opt

Step:2) Copy media.repo file from mounted directory to /etc/yum.repos.d/

In our case RHEL 8 Installation DVD or ISO file is mounted under /opt folder, use cp command to copy media.repo file to /etc/yum.repos.d/ directory,

[root@linuxtechi-rhel8 ~]# cp -v /opt/media.repo /etc/yum.repos.d/rhel8.repo
'/opt/media.repo' -> '/etc/yum.repos.d/rhel8.repo'
[root@linuxtechi-rhel8 ~]#

Set “644” permission on “/etc/yum.repos.d/rhel8.repo

[root@linuxtechi-rhel8 ~]# chmod 644 /etc/yum.repos.d/rhel8.repo
[root@linuxtechi-rhel8 ~]#

Step:3) Add repository entries in “/etc/yum.repos.d/rhel8.repo” file

By default, rhel8.repo file will have following content,

default-rhel8-repo-file

Edit rhel8.repo file and add the following contents,

[root@linuxtechi-rhel8 ~]# vi /etc/yum.repos.d/rhel8.repo
[InstallMedia-BaseOS]
name=Red Hat Enterprise Linux 8 - BaseOS
metadata_expire=-1
gpgcheck=1
enabled=1
baseurl=file:///opt/BaseOS/
gpgkey=file:///etc/pki/rpm-gpg/RPM-GPG-KEY-redhat-release

[InstallMedia-AppStream]
name=Red Hat Enterprise Linux 8 - AppStream
metadata_expire=-1
gpgcheck=1
enabled=1
baseurl=file:///opt/AppStream/
gpgkey=file:///etc/pki/rpm-gpg/RPM-GPG-KEY-redhat-release

rhel8.repo should look like above once we add the content, In case you have mounted the Installation DVD or ISO on different folder then change the location and folder name in base url line for both repositories and rest of parameter leave as it is.

Step:4) Clean Yum / DNF and Subscription Manager Cache 

Use the following command to clear yum or dnf and subscription manager cache,

root@linuxtechi-rhel8 ~]# dnf clean all
[root@linuxtechi-rhel8 ~]# subscription-manager clean
All local data removed
[root@linuxtechi-rhel8 ~]#

Step:5) Verify whether Yum / DNF is getting packages from Local Repo

Use dnf or yum repolist command to verify whether these commands are getting packages from Local repositories or not.

[root@linuxtechi-rhel8 ~]# dnf repolist
Updating Subscription Management repositories.
Unable to read consumer identity
This system is not registered to Red Hat Subscription Management. You can use subscription-manager to register.
Last metadata expiration check: 1:32:44 ago on Sat 11 May 2019 08:48:24 AM BST.
repo id                 repo name                                         status
InstallMedia-AppStream  Red Hat Enterprise Linux 8 - AppStream            4,672
InstallMedia-BaseOS     Red Hat Enterprise Linux 8 - BaseOS               1,658
[root@linuxtechi-rhel8 ~]#

Note : You can use either dnf or yum command, if you use yum command then its request is redirecting to DNF itself because in RHEL 8 yum is based on DNF command.

If you have noticed the above command output carefully, we are getting warning message “This system is not registered to Red Hat Subscription Management. You can use subscription-manager to register”, if you want to suppress or prevent this message while running dnf / yum command then edit the file “/etc/yum/pluginconf.d/subscription-manager.conf”, changed the parameter “enabled=1” to “enabled=0”

[root@linuxtechi-rhel8 ~]# vi /etc/yum/pluginconf.d/subscription-manager.conf
[main]
enabled=0

save and exit the file.

Step:6) Installing packages using DNF / Yum

Let’s assume we want to install nginx web server then run below dnf command,

[root@linuxtechi-rhel8 ~]# dnf install nginx

Similarly if you want to install LEMP stack on your RHEL 8 system use the following dnf command,

[root@linuxtechi-rhel8 ~]# dnf install nginx mariadb php -y

This confirms that we have successfully configured Local yum / dnf repository on our RHEL 8 server using Installation DVD or ISO file.

In case these steps help you technically, please do share your feedback and comments.

Monitor and Manage Docker Containers with Portainer.io (GUI tool) – Part-2

$
0
0

As a continuation of Part-1, this part-2 has remaining features of Portainer covered and as explained below.

Monitoring docker container images

shashi@linuxtechi ~}$ docker ps -a
CONTAINER ID        IMAGE                 COMMAND             CREATED             STATUS   PORTS                             NAMES
9ab9aa72f015        ubuntu                "/bin/bash"         14 seconds ago      Exited (0) 12 seconds ago                  suspicious_shannon
305369d3b2bb        centos                "/bin/bash"         24 seconds ago      Exited (0) 22 seconds ago                  admiring_mestorf
9a669f3dc4f6        portainer/portainer   "/portainer"        7 minutes ago       Up 7 minutes   0.0.0.0:9000->9000/tcp      trusting_keller

Including the portainer(which is a docker container image), all the exited and present running docker images are displayed. Below screenshot from Portainer GUI displays the same.

Docker_status

Monitoring events

Click on the “Events” option from the portainer webpage as shown below.

Various events that are generated and created based on docker-container activity, are captured and displayed in this page

Container-Events-Poratiner-GUI

Now to check and validate how the “Events” section works. Create a new docker-container image redis as explained below, check the docker ps –a status at docker command-line.

shashi@linuxtechi ~}$ docker ps -a
CONTAINER ID        IMAGE                 COMMAND                  CREATED              STATUS         PORTS                    NAMES
cdbfbef59c31        redis                 "docker-entrypoint.s…"   About a minute ago   Up About a minute         6379/tcp                 angry_varahamihira
9ab9aa72f015        ubuntu                "/bin/bash"              10 minutes ago       Exited (0) 10 minutes ago                            suspicious_shannon
305369d3b2bb        centos                "/bin/bash"              11 minutes ago       Exited (0) 11 minutes ago                            admiring_mestorf
9a669f3dc4f6        portainer/portainer   "/portainer"             17 minutes ago       Up 17 minutes         0.0.0.0:9000->9000/tcp   trusting_keller

Click the “Event List” on the top to refresh the events list,

events_updated

Now the event’s page also updated with this change,

Host status

Below is the screenshot of the portainer displaying the host status. This is a simple window showing-up. This shows the basic info like “CPU”, “hostname”, “OS info” etc of the host linux machine. Instead of logging- into the host command-line, this page provides very useful info on for quick glance.

Host-names-Portainer

Dashboard in Portainer

Until now we have seen various features of portainer based under “Local” section. Now jump on to the “Dashboard” section of the selected Docker Container image.

When “EndPoint” option is clicked in the GUI of Portainer, the following window appears,

End_Point_Settings

This Dashboard has many statuses and options, for a host container image.

1) Stacks: Clicking on this option, provides status of any stacks if any. Since there are no stacks, this displays zero.

2) Images: Clicking on this option provides host of container images that are available. This option will display all the live and exited container images

Docker-Container-Images-Portainer

For example create one more “Nginx” container and refresh this list to see the updates.

shashi@linuxtechi ~}$  sudo docker run nginx
Unable to find image 'nginx:latest' locally
latest: Pulling from library/nginx
27833a3ba0a5: Pull complete
ea005e36e544: Pull complete
d172c7f0578d: Pull complete
Digest: sha256:e71b1bf4281f25533cf15e6e5f9be4dac74d2328152edf7ecde23abc54e16c1c
Status: Downloaded newer image for nginx:latest

The following is the image after refresh,

Nginx_Image_creation

Once the Nginx image is stopped/killed and docker container image will be moved to unused status.

Note:-One can see all the image details here are very clear with memory usage, creation date and time. As compared to command-line option, maintaining and monitoring containers from here it will be very easy.

3) Networks: this option is used for network operations. Like assigning IP address, creating subnets, providing IP address range, access control (admin and normal user) . The following window provides the details of various options possible. Based on your need these options can be explored further.

Conatiner-Network-Portainer

Once all the various networking parameters are entered, “create network” button is clicked for creating the network.

4) Container: (click on container) This option will provide the container status. This list will provide details on live and not running container statuses. This output is similar to docker ps command option.

Containers-Status-Portainer

From this window only the containers can be stopped and started as need arises by checking the check box and selecting the above buttons. One example is provided as below,

Example, Both “CentOS” and “Ubuntu” containers which are in stopped state, they are started now by selecting check boxes and hitting “Start” button.

start_containers1

start_containers2

Note: Since both are Linux container images, they will not be started. Portainer tries to start and stops later. Try “Nginx” instead and you can see it coming to “running”status.

start_containers3

5) Volume: Described in Part-I of Portainer Article

Setting option in Portainer

Until now we have seen various features of portainer based under “Local” section. Now jump on to the “Setting” section of the selected Docker Container image.

When “Settings” option is clicked in the GUI of Portainer, the following further configuration options are available,

1) Extensions: This is a simple Portainer CE subscription process. The details and uses can be seen from the attached window. This is mainly used for maintaining the license and subscription of the respective version.

Extensions

2) Users: This option is used for adding “users” with or without administrative privileges. Following example provides the same.

Enter the selected user name “shashi” in this case and your choice of password and hit “Create User” button below.

create_user_portainer

create_user2_portainer

Internal-user-Portainer

Similarly the just now created user “shashi” can be removed by selecting the check box and hitting remove button.

user_remove_portainer

3) Endpoints: this option is used for Endpoint management. Endpoints can be added and removed as shown in the attached windows.

Endpoint-Portainer-GUI

The new endpoint “shashi” is created using the various default parameters as shown below,

Endpoint2-Portainer-GUI

Similarly this endpoint can be removed by clicking the check box and hitting remove button.

4) Registries: this option is used for registry management. As docker hub has registry of various images, this feature can be used for similar purposes.

Registry-Portainer-GUI

With the default options the “shashi-registry” can be created.

Registry2-Portainer-GUI

Similarly this can be removed if not required.

5) Settings: This option is used for the following various options,

  • Setting-up snapshot interval
  • For using custom logo
  • To create external templates
  • Security features like- Disable and enable bin mounts for non-admins, Disable/enable privileges for non-admins, Enabling host management features

Following screenshot shows some options enabled and disabled for demonstration purposes. Once all done hit on “Save Settings” button to save all these options.

Portainer-GUI-Settings

Now one more option pops-up on “Authentication settings” for LDAP, Internal or OAuth extension as shown below”

Authentication-Portainer-GUI-Settings

Based on what level of security features we want for our environment, respective option is chosen.

That’s all from this article, I hope these Portainer GUI articles helps you to manage and monitor containers more efficiently.  Please do share your feedback and comments.

How to Download and Use Ansible Galaxy Roles in Ansible Playbook

$
0
0

Ansible is tool of choice these days if you must manage multiple devices, be it Linux, Windows, Mac, Network Devices, VMware and lot more. What makes Ansible popular is its agent less feature and granular control. If you have worked with python or have experience with yaml, you will feel at home with Ansible. To see how you can install Ansible click here.

Download-Use-Ansible-Galaxy-Roles

Ansible core modules will let you manage almost anything should you wish to write playbooks, however often there is someone who has already written a role for a problem you are trying to solve. Let’s take an example, you wish to manage NTP clients on the Linux machines, you have 2 choices either write a role which can be applied to the nodes or use ansible-galaxy to download an existing role someone has already written/tested for you. Ansible galaxy has roles for almost all the domains and these caters different problems. You can visit https://galaxy.ansible.com/ to get an idea on domains and popular roles it has. Each role published on galaxy repository is thoroughly tested and has been rated by the users, so you get an idea on how other people who have used it liked it.

To keep moving with the NTP idea, here is how you can search and install an NTP role from galaxy.

Firstly, lets run ansible-galaxy with the help flag to check what options does it give us

[root@ansible ~]# ansible-galaxy --help

ansible-galaxy-help

As you can see from the output above there are some interesting options been shown, since we are looking for a role to manage ntp clients lets try the search option to see how good it is finding what we are looking for.

[root@ansible ~]# ansible-galaxy search ntp

Here is the truncated output of the command above.

ansible-galaxy-search

It found 341 matches based on our search, as you can see from the output above many of these roles are not even related to NTP which means our search needs some refinement however, it has managed to pull some NTP roles, lets dig deeper to see what these roles are. But before that let me tell you the naming convention being followed here. The name of a role is always preceded by the author name so that it is easy to segregate roles with the same name. So, if you have written an NTP role and have published it to galaxy repo, it does not get mixed up with someone else repo with the same name.

With that out of the way, lets continue with our job of installing a NTP role for our Linux machines. Let’s try bennojoy.ntp for this example, but before using this we need to figure out couple of things, is this role compatible with the version of ansible I am running. Also, what is the license status of this role. To figure out these, let’s run below ansible-galaxy command,

[root@ansible ~]# ansible-galaxy info bennojoy.ntp

ansible-galaxy-info

ok so this says the minimum version is 1.4 and the license is BSD, lets download it

[root@ansible ~]# ansible-galaxy install bennojoy.ntp
- downloading role 'ntp', owned by bennojoy
- downloading role from https://github.com/bennojoy/ntp/archive/master.tar.gz
- extracting bennojoy.ntp to /etc/ansible/roles/bennojoy.ntp
- bennojoy.ntp (master) was installed successfully
[root@ansible ~]# ansible-galaxy list
- bennojoy.ntp, master
[root@ansible ~]#

Let’s find the newly installed role.

[root@ansible ~]# cd /etc/ansible/roles/bennojoy.ntp/
[root@ansible bennojoy.ntp]# ls -l
total 4
drwxr-xr-x. 2 root root   21 May 21 22:38 defaults
drwxr-xr-x. 2 root root   21 May 21 22:38 handlers
drwxr-xr-x. 2 root root   48 May 21 22:38 meta
-rw-rw-r--. 1 root root 1328 Apr 20  2016 README.md
drwxr-xr-x. 2 root root   21 May 21 22:38 tasks
drwxr-xr-x. 2 root root   24 May 21 22:38 templates
drwxr-xr-x. 2 root root   55 May 21 22:38 vars
[root@ansible bennojoy.ntp]#

I am going to run this newly downloaded role on my Elasticsearch CentOS node. Here is my hosts file

[root@ansible ~]# cat hosts
[CentOS]
elastic7-01 ansible_host=192.168.1.15 ansibel_port=22 ansible_user=linuxtechi
[root@ansible ~]#

Let’s try to ping the node using below ansible ping module,

[root@ansible ~]# ansible -m ping -i hosts elastic7-01
elastic7-01 | SUCCESS => {
    "changed": false,
    "ping": "pong"
}
[root@ansible ~]#

Here is what the current ntp.conf looks like on elastic node.

[root@elastic7-01 ~]# head -30 /etc/ntp.conf

Current-ntp-conf

Since I am in India, lets add server in.pool.ntp.org to ntp.conf. I would have to edit the variables in default directory of the role.

[root@ansible ~]# vi /etc/ansible/roles/bennojoy.ntp/defaults/main.yml

Change NTP server address in “ntp_server” parameter, after updating it should look like below.

Update-ansible-ntp-role

The last thing now is to create my playbook which would call this role.

[root@ansible ~]# vi ntpsite.yaml
---
 - name: Configure NTP on CentOS/RHEL/Debian System
   become: true
   hosts: all
   roles:
    - {role: bennojoy.ntp}

save and exit the file

We are ready to run this role now, use below command to run ntp playbook,

[root@ansible ~]# ansible-playbook -i hosts ntpsite.yaml

Output of above ntp ansible playbook should be something like below,

ansible-playbook-output

Let’s check updated file now. go to elastic node and view the contents of ntp.conf file

[root@elastic7-01 ~]# cat /etc/ntp.conf
#Ansible managed

driftfile /var/lib/ntp/drift
server in.pool.ntp.org

restrict -4 default kod notrap nomodify nopeer noquery
restrict -6 default kod notrap nomodify nopeer noquery
restrict 127.0.0.1
[root@elastic7-01 ~]#

Just in case you do not find a role fulfilling your requirement ansible-galaxy can help you create a directory structure for your custom roles. This helps your playbooks along with the variables, handlers, templates etc assembled in a standardized file structure. Let’s create our own role, its always a good practice to let ansible-galaxy create the structure for you.

[root@ansible ~]# ansible-galaxy init pk.backup
- pk.backup was created successfully
[root@ansible ~]#

Verify the structure of your role using the tree command,

createing-roles-ansible-galaxy

Let me quickly explain what each of these directories and files are for, each of these serves a purpose.

The very first one is the defaults directory which contains the files containing variables with takes the lowest precedence, if the same variables are assigned in var directory it will be take precedence over default. The handlers directory hosts the handlers. The file and templates keep any files your role may need to copy and jinja templates to be used in playbooks respectively. The tasks directory is where your playbooks containing the tasks are kept. The var directory consists of all the files that hosts the variables used in role. The test directory consists of a sample inventory and test playbooks which can be used to test the role. The meta directory consists of any dependencies on other roles along with the authorship information.

Finally, README.md file simply consists of some general information like description and minimum version of ansible this role is compatible with.

Viewing all 466 articles
Browse latest View live